Melissa Lane • Jun 15, 2018
Favorite Astro Plots: The Pyroxene Quadrilateral
The popularity of planetary science and astronomy has a lot to do with fascinating, bizarre, stark, and beautiful photos of worlds unknown. Pictures of space capture attention and reel people in. But interpreting those images to study planetary processes such as impact cratering rates, dune structures, rock strata, etc. is only a very small portion of the work of everyday planetary scientists and astronomers. Terabytes of data from every space mission are of the non-image kind.
Planetary scientists interpret those non-photographic data and try to make sense of it. Once a scientist understands the secrets of the data, their job is to make it understandable for non-specialists and non-scientists, and it would be almost impossible to find a science journal article that does not use graphs to help tell the story of the data. Graphs, like a picture, are worth a thousand words.
Petrology is a field of science in which scientists study the compositions of rocks and minerals and interpret their geologic history. A common graph petrologists use is the “pyroxene quadrilateral”, used to plot the compositions of common rock-forming minerals called pyroxenes. These graphs, like photos of space, can reveal an understanding of the remotest parts of the solar system.
Minerals of all types are made by a repeating pattern of molecules. For a simple one like table salt, the sodium chloride molecule (NaCl) is repeated over and over. Within the silicate class of minerals there is a more complex mineral group called pyroxene. Pyroxene compositions are generally written as XY(Si,Al)2O6, where X and Y are positively charged ions (cations), usually calcium, magnesium, or iron (Ca, Mg, or Fe). The overall structure of this mineral is constant -- the atoms are arranged in the same repeating pattern regardless of which cations are present -- but the cations can substitute for each other, making pyroxene minerals of various compositions.

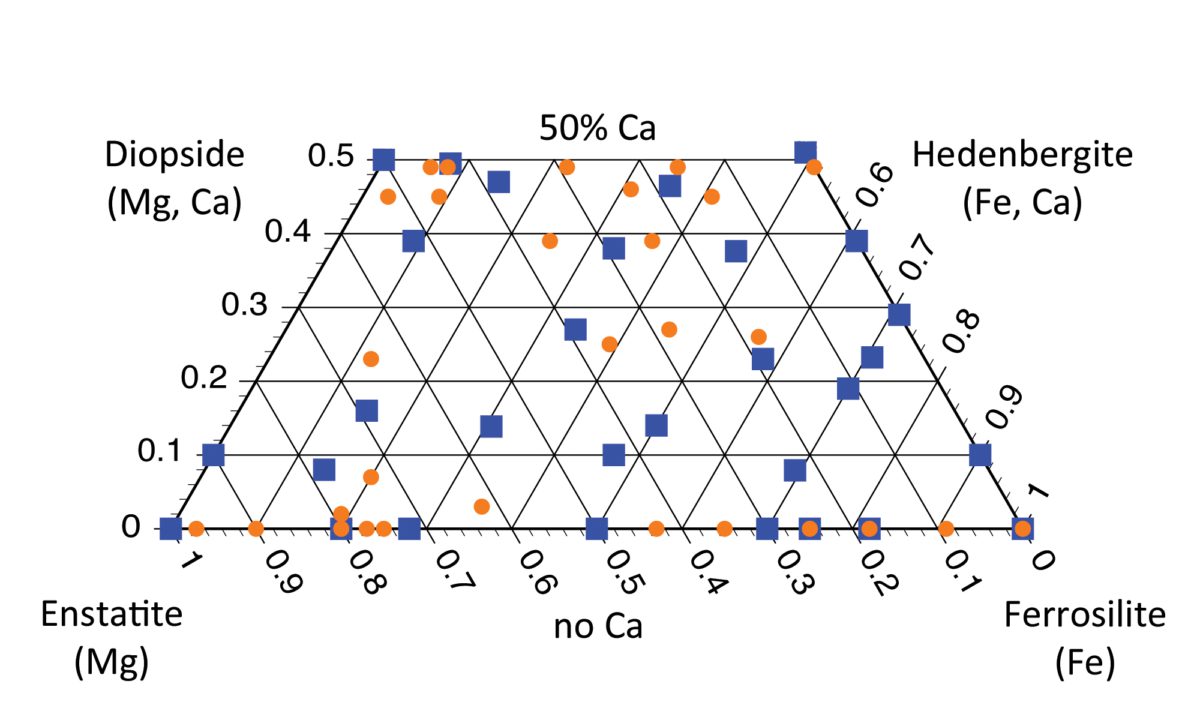
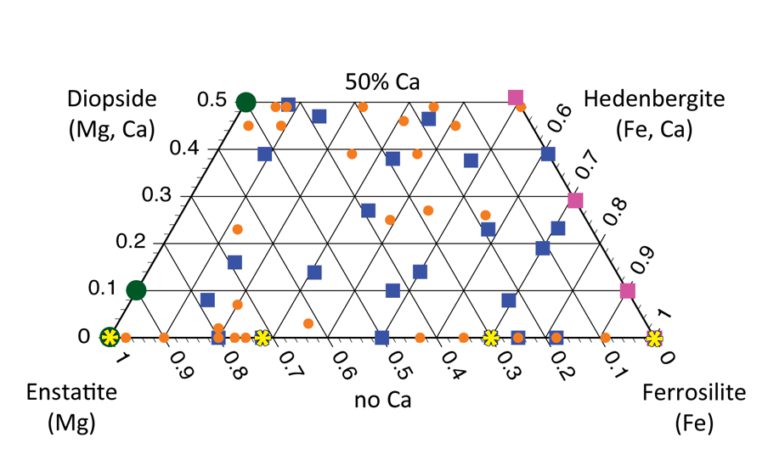
Below is a graph called a “pyroxene quadrilateral.” Stick with my blog and you will fully understand this graph by the end and gain some insight into what the pyroxene quadrilateral is and what the plotted pyroxene compositions can tell you!

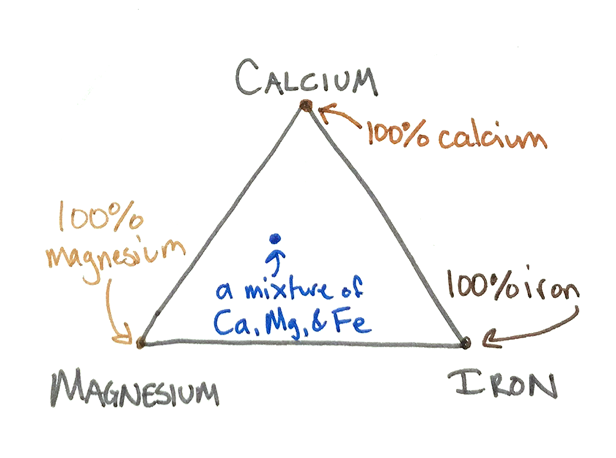
Picture the pyroxene quadrilateral above as if the sides were extended into a triangle. Each point of the triangle represents one element – calcium at the top, magnesium at the bottom left, and iron at the bottom right.
If all the cations in the pyroxene were magnesium, the mineral would plot at the bottom left tip of the triangle and be called enstatite. If all the cations in the pyroxene were iron, the mineral would plot at the bottom right tip of the triangle and be called ferrosilite. If all the cations involved were calcium, the mineral would plot at the top tip of the triangle and be called wollastonite. These mineral names all refer to "endmembers" -- pure forms of minerals that we actually rarely see in nature. Most natural materials plot somewhere away from those pure endpoints.
But you may have noticed that my diagram isn't a triangle. It's truncated -- the top of the triangle is missing, leaving my diagram as a trapezoidal shape. That happens because calcium ions are so large (by comparison to magnesium and iron cations), putting them into a pyroxene causes the mineral to deform away from a true pyroxene structure. At most, ONLY HALF of the cations in a pyroxene can be calcium, or its crystal pattern no longer looks like a pyroxene. The “pyroxene quadrilateral” bounds the possible pyroxene compositions to no more than 50% calcium, plus 50% or more magnesium and/or iron.

Why composition matters
Why do we care which cations are present in a pyroxene crystal? Pyroxenes of different compositions crystallize under specific chemical and environmental conditions. The compositions of pyroxene crystals in a rock act as historical temperature records. Geologists use them to interpret the evolution of the magma, from liquid to cooled rock. Helpfully, pyroxene minerals are some of the most abundant minerals in the solar system. They are plentiful in meteorites and other igneous rocks. Their name is derived from the Greek pyro (“fire”) and xenos (“stranger”) because these minerals, which form early as a lava cools from liquid to solid, can often be the only visible crystals in an otherwise fine-grained rock. (e.g., Wells, 1977; Taylor, 1998; Lindsley, 1983; Abell et al., 2007; Klima et al., 2008).
Here's an example of how a geologist might use a pyroxene mineral composition to read the history of a rock. Typical igneous rocks commonly contain two different pyroxenes: a high-calcium pyroxene and a low-calcium pyroxene. Generally, the amount of calcium in a high-calcium pyroxene decreases with increasing temperature, while the amount of calcium in low-calcium pyroxenes tends to increase with increasing temperature. Geologists are really sleuths trying to interpret the story the rock is telling them, and using this “two-pyroxene thermometer” is one tool they use to, for example, figure out the eruption temperature of a lava. How cool (hot) is that?
These parameters (as one example) can tell a scientist a lot about rocks that form on other solar system bodies and meteorites, too, and can sometimes tell which parent body a meteorite came from! In my work, we've performed laboratory spectroscopy studies of pyroxenes of a wide variety of known compositions (marked by orange dots and blue squares on the quadrilateral). The paper we are writing will provide the spectroscopy community with a reference for translating spectra taken by orbiting or roving spacecraft into pyroxene compositions. That will help scientists who use spectroscopy to tell the geologic history of a space rock without ever touching it.
I hope you now understand the pyroxene quadrilateral and what it tells one about mineral composition, which in turn, tells scientists about the geology on the Solar System body being studied. You earned an A+ for reaching the end of this blog and you also gained a new understanding about day-to-day planetary science conducted without photographic images of those far-away worlds.
This article concerns Lane, M. D., R. L. Klima, T. D. Glotch, and M. D. Dyar (in preparation, 2018) Mid-infrared spectroscopy of synthetic Ca-Mg-Fe pyroxenes using thermal emission and diffuse reflectance techniques, to be submitted to Meteoritics and Planetary Science.
Further reading about pyroxene as a geothermometer:
Abell, P. A., F. Vilas, K. S. Jarvis, M. J. Gaffey, and M. S. Kelley (2007) Mineralogical composition of (25143) Itokawa 1998 SF26 from visible and near-infrared reflectance spectroscopy: Evidence for partial melting, Meteoritics and Planetary Science, 42, 2165-2177.
Klima, R. L., Pieters, C. M., and Dyar, M. D. (2008) Characterization of the 1.2 mm M1 pyroxene band: Extracting cooling history from near-IR spectra of pyroxenes and pyroxene-dominated rocks. Meteoritics and Planetary Science 43:1591-1604.
Lindsley, D. H. (1983) Pyroxene thermometry. American Mineralogist 68:477-493.
Taylor, W. R. (1998) An experimental test of some geothermometer and geobarometer formulations for upper mantle peridotites with application to the thermobarometry of fertile lherzolite and garnet websterite. Neues Jahrbuch für Mineral.-Abhandlungen Band 172:381-408.
Wells, P. R. A. (1977) Pyroxene thermometry in simple and complex systems. Contributions to Mineralogy and Petrology, 62, 129-139.
Support our core enterprises
Your support powers our mission to explore worlds, find life, and defend Earth. You make all the difference when you make a gift. Give today!
Donate

 Explore Worlds
 Find Life
 Defend Earth


