Jingjing Chen • Apr 15, 2016
Favorite Astro Plots #4: Classifying Exoplanets
Mass and size. Two of the most fundamental properties of any object. So fundamental that they are two of the seven “base units” in the International System of Units. In astronomy, measuring (rather than just guesstimating) both the mass and radius of other worlds is tough and, until just a few years ago, a plot of mass versus size of other worlds would have looked pretty sparse and uninformative. But thanks to the tireless efforts of exoplanet astronomers, we now know fairly precise masses and radii for hundreds of distant worlds. Welcome to the era of big exoplanet data!
You are probably used to thinking of mass and radius as being “properties” or “parameters” of an object. But a data scientist interested in classifying the data into different groups would call them “features”.
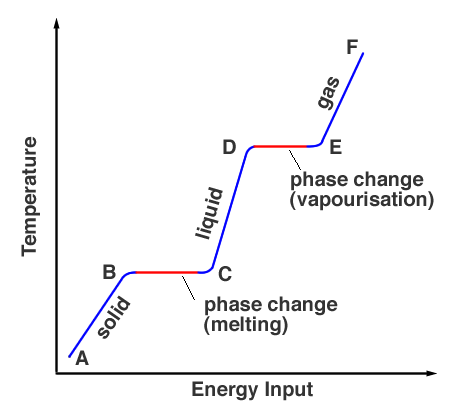
Classifying data using features can sometimes provide important physical insights, with a nice example coming from the case of phase changes for H2O. Imagine having a sealed box full of water ice for which you are only able to measure what the temperature inside the box is. Let’s say you start heating the box up (increasing the energy input). You’ll observe that the temperature inside the box will increase, as shown in the plot below. But then you’ll notice the thermometer stabilizes at 0oC for a while, even though you’re still heating the box! This is because the energy is being used to transform the ice from solid to liquid (although remember you don’t know this because you can’t see inside the box!). Now take a data scientist and show them the temperature versus energy input data shown below. They would apply a classification algorithm and be able to identify the three phases of matter, even though they were never able to peer inside the box and actually see the different phases.
In my recent paper, I was interested in applying this kind of thinking to mass and radius of different worlds. Could we classify the planets? The plot below compares the mass with the size of any object massive enough to look round (i.e. dwarf planets) all the way up to stars which have not yet lived long enough to become giant stars. The least massive world shown in this plot is smaller than the Moon, while the most massive world extends to stars a little smaller than the Sun. Aside from the eight Solar System planets (the orange symbols), this plot includes the moons and dwarf planets in our Solar System, and about 300 extrasolar worlds detected through a variety of techniques.
Just like the temperature-versus-energy input plot from before, it is clear that a single straight-line relation would not fit all of the data. This is because different worlds have different compositions and different underlying physics that govern the relation between mass and radius -- there are phase changes! So instead of a single straight line, we fit a broken power-law between mass and radius. The transitional points between each pair of relations are fitted as a part of our model, which essentially means that we are performing classification of these worlds.
The first transition happens at 2 Earth masses, corresponding to about 1.23 Earth radius. We labeled the category below this point as the “Terran worlds”, because the Earth is a typical member. Many Solar System worlds, including Mercury, Venus, Mars, as well as the moons and dwarf planets, all belong to this category, exhibiting a tight relationship between mass and radius. Its neighboring category is labeled as the “Neptunian worlds”, containing three of the outer planets in the Solar System—Saturn, Uranus, and Neptune. Worlds in this category possess significant volatile envelopes, which makes their radii increase much more rapidly than the radii of the Terran worlds. Saturn sits on the verge of the Neptunian category, just to the right of the second transition, which occurs at 0.41 Jupiter mass (or around 130 Earth mass). In fact, using the classification derived in our project, Saturn is 95% likely to be a Neptunian world and 5% likely to be a Jovian world (Jupiter-like). The next category—“Jovian worlds” is kind of special. In this category, all the worlds have almost the same radius, despite the fact that mass has increased for more than 100 times. This category contains the most massive kind of planets and brown dwarfs. Some classification regards planets and brown dwarfs to be different. However, as is shown in the plot, brown dwarfs follow the same mass-radius relation as the most massive planets. The last transition is at 0.08 Solar mass. Above this limit, the internal pressures are sufficiently high that its core will be able to ignite a hydrogen nuclear fusion chain reaction. Hence the last category, “Stellar worlds”, contains stars.
Aside from classification, this mass-radius relation can also be used for forecasting. Through the past two decades, astronomers have discovered thousands of extrasolar worlds. But most of these detections measure either the mass (e.g. radial velocity) or the radius (e.g. transit). The mass-radius relation allows us to predict the mass (radius) with the other measurements.
Looking at data in this way leads to surprising implications. Brown dwarfs are merely high-mass Jupiters. Dwarf planets, like Pluto, are merely low-mass members of the same class containing the Earth. Perhaps the most surprisingly result is that the divide between Neptunian worlds and solid planets like the Earth occurs at just 2 Earth masses. This leaves very little room for Super-Earths and suggests gaseous planets occur at much lower masses than we initially expected. Effectively then, the Earth is the Super-Earth we have been looking for all along.
Support our core enterprises
Your support powers our mission to explore worlds, find life, and defend Earth. You make all the difference when you make a gift. Give today!
Donate

 Explore Worlds
 Find Life
 Defend Earth


