Emily Lakdawalla • Apr 19, 2016
A new angle on Mars for Mars Odyssey
An earlier version of this post had an incorrect explanation for one aspect of Odyssey's imaging geometry; this post has been modified on April 22 with input from Odyssey project scientist Jeff Plaut. --ESL
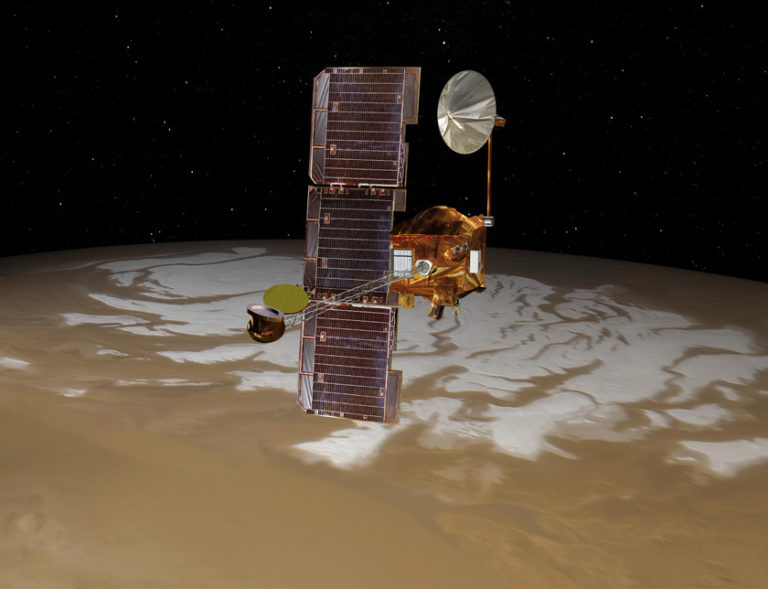
Mars Odyssey has been in space for 15 years, and has been returning science data from Mars since February of 2002. It flies in a special "sun-synchronous" orbit. It crosses the equator at roughly the same local time every day. Over time, the Odyssey mission has changed what that local time of day is, and I just realized something cool about how those changes show up in the geometry of its images.

First of all, a brief word on the way a sun-synchronous orbit works at Mars. Odyssey's orbit is nearly, but not quite, polar (with an inclination of 93.1 degrees). At that inclination, the orbit precesses at the same rate that Mars orbits the Sun, on average, so the spacecraft maintains a close-to-constant angle from the Sun, to Mars, to the plane of the orbit. The orbit would be perfectly sun-synchronous if Mars' orbit were perfectly circular. But it's not; in fact, Mars' orbit is noticeably elliptical. Planets move at faster angular rates in some parts of elliptical orbits than others, which messes up the perfect balance of Odyssey's orbit precession with Mars' orbital motion. As a result, Odyssey's "sun-synchronous" orbit crosses the equator at a slightly different time of day depending on where Mars is in its orbit around the Sun, varying by plus or minus 45 minutes or so over the course of the year.
When Odyssey first started returning science data from Mars, it crossed the equator from north to south at about 3pm, local time. But the mission adjusted the orbit to one that crossed the equator a little later -- to an average of about 4:45pm, local time -- to help the performance of Odyssey's Gamma Ray Spectrometer, which wasn't very happy looking at a hot afternoon Martian surface. Beginning in 2003, the relatively late time of day for Odyssey's orbit was also beneficial for communications with the Mars Exploration Rovers, which could usually finish their activity during the warmest part of the day, then communicate with Odyssey late in the afternoon, and then go straight to sleep for the cold night.
But the late-afternoon orbit was not ideal for Odyssey's imaging system, THEMIS. Seeing Mars as late as 5:30pm, there were dramatic shadows from topography that were picturesque, but hid surface detail. Moreover, the best THEMIS science came from comparing thermal images taken during the hottest part of the day (around 3 pm) with images taken during a cold time at of the night (3 am); the late afternoon images were just not as good for thermal science. So, finally, late in 2008, the Odyssey mission was permitted to adjust Odyssey's orbit to one that crossed Mars' equator earlier in the day, around 3:30pm, on average.
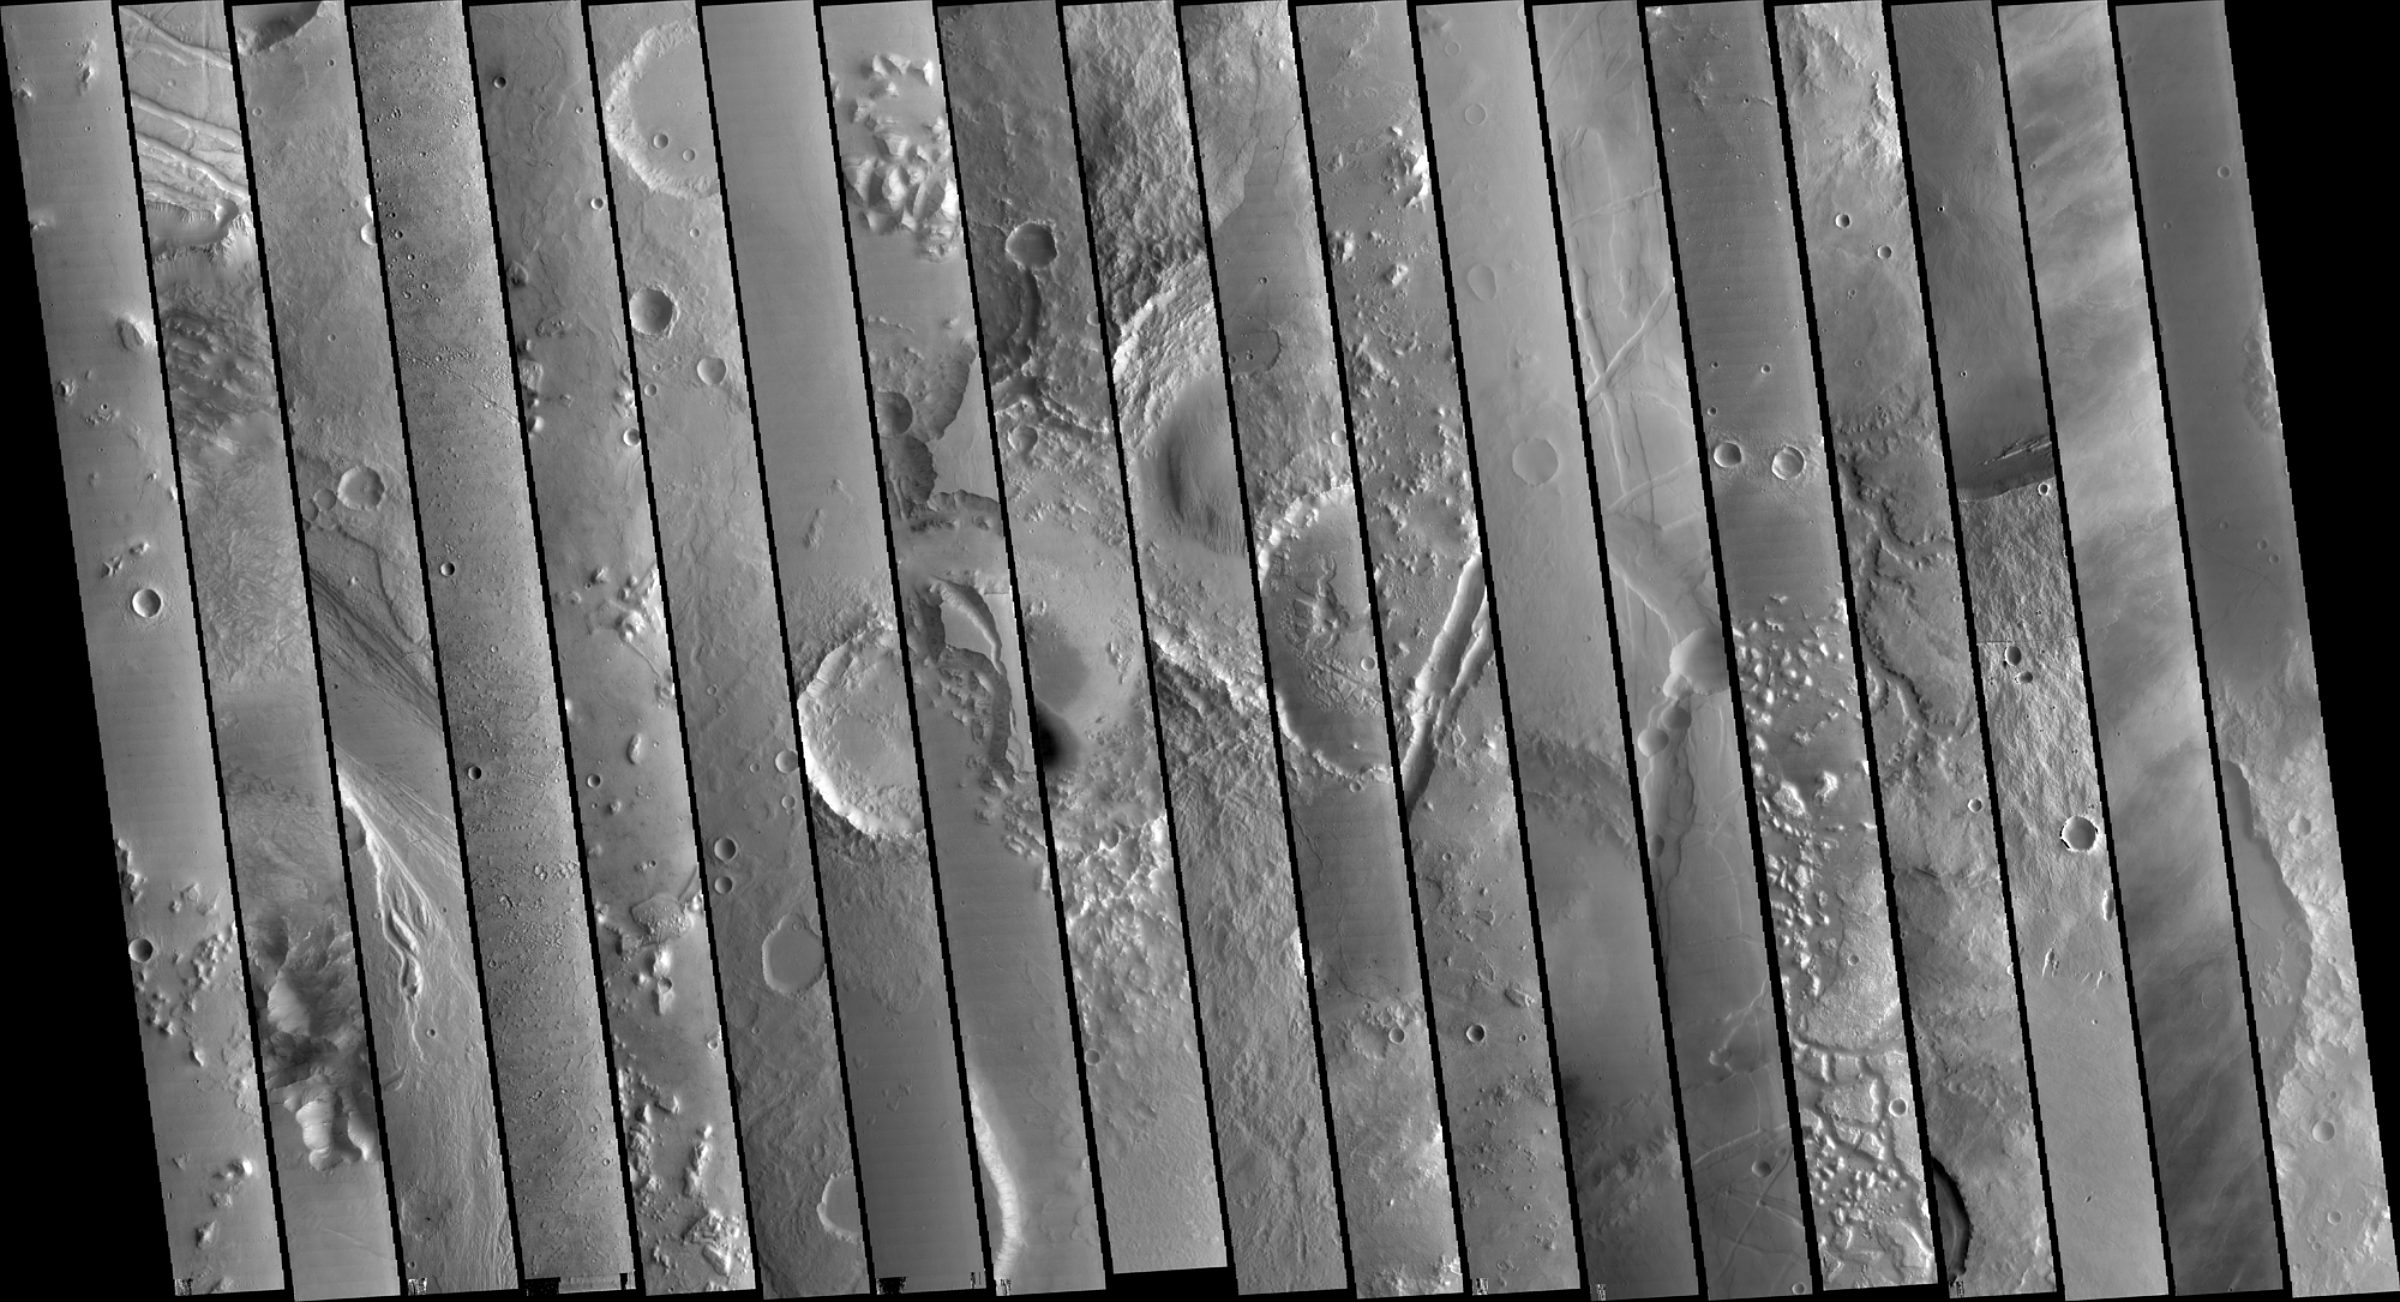
Here are three example THEMIS visible images from the three phases of the mission I've talked about so far. The one on the left was taken shortly after the science mission began, on March 16, 2002, just after 3pm local time. The one in the middle was taken at a part of Mars' orbit when Odyssey was crossing the equator at a particularly late time of day, on May 11, 2003, at around 5:20pm local time. The Sun is close to setting, and is throwing deep, dark shadows from crater rims. The low-angle light is great for viewing subtle topography, like the rumpled ejecta blankets of craters, but it hides subtle reflectivity variations across the lava flows in the scene. The one on the right was taken August 28, 2009, after the orbit had been allowed to drift earlier in the day, at about 2:40pm local time. We see craters, but the Sun is high enough to still illuminate all of the visible walls, and the plains between the craters show subtle albedo variations that could result from composition or textural differences.

THEMIS principal investigator Phil Christensen promised better science from the early-afternoon orbit; I didn't have time to dig into the NASA ADS abstract system to evaluate the difference in science results between the late-afternoon and early-afternoon phases of the mission. I leave that as an exercise for the reader :)
But that phase of the mission is over now. In February 2014, the navigators gave Odyssey a nudge that let its orbit drift in longitude, slowly later, very slowly, passing the late-afternoon time it had spent its prime mission in, then later, and later until, late in 2014, its descending equator crossing happened around sunset. That pushed the ascending equator crossing to sunrise. On November 10, 2015, they halted the orbital drift. Now the equator crossings are constant (plus or minus the shifts caused by Mars' elliptical orbit) around 6am and 6pm, local time.
Late in 2014 they did quite a lot of early morning imaging that's now available in the Planetary Data System, and I've had a fun time browsing through some of it, seeing how different Mars looks from this new angle. Sit back from the screen and you can notice the most fundamental difference between the morning images I show below and the afternoon images I show above: because in the morning Odyssey sees daylit Mars on the ascending, rather than descending leg of its orbit, the images tilt the opposite direction from the way they did in the prime mission. This is how you can tell the time of day of an Odyssey image at a glance: if their tops slant to the right, they're afternoon images, and if they slant to the left, they're morning images. It's also strange to me to see the west sides of crater walls being sunlit -- I'm so used to virtually all Mars orbital images having the afternoon illumination of sunlight on eastern sides of craters. Zoom in closer, and in some of the images you can see what the THEMIS team was looking for: morning fog, softening the view of the Martian landscape.

To prepare for writing this post, I needed to get a sense of how the imaging times of day have changed over the course of Odyssey's mission. So I found data describing all of THEMIS visible imaging throughout its mission up to the end of September, 2015, and then I plotted the local time of day of the image through time. The graph surprised me. There was a definite Mars-year signal in there, but what was the spread of all the points, and why did the points spread upward (later time of day) at some times of year and downward (earlier time of day) at other times of year? And what was the gap in 2007?
I suspected that the spread in points had to do with Odyssey slewing off-nadir to target images at spots that weren't directly beneath the spacecraft. (I turned out to be wrong about this; I'll explain below.) So I made the graph again but this time I split the data into chunks based on the image's center latitude. I found out that the spread in image time of day was closely related to latitude: if I just looked at images within 30 degrees of the equator, the dots clustered very tightly. I recognized that the time swings also had to do with seasons: Odyssey can only image the poles when they're sunlit, during their summer. There's a clear signal of the 687-day Mars orbit, and the lopsidedness of the sinusoidish shape has to do with Mars moving faster near perihelion (which coincides with south polar summer) than aphelion (which coincides with north polar summer). And you can see how, in 2014, Odyssey THEMIS started getting images both morning and evening in its new 6am/6pm orbit.

Although latitude clearly plays a role in the spread in points, it's not for the reason I originally thought. Jeff Plaut, Odyssey project scientist, set me straight:
The actual cause of the spread is simply the geometry of Odyssey’s slightly inclined orbit. On a given Mars sol, the local time of Odyssey’s orbit is anchored at the equator, and is constant at a given longitude. But Odyssey’s ground track makes an angle with respect to longitude and thus moves away from the local time you would find on that orbit at the equator. The reason this effect appears seasonal is simply because THEMIS vis is targeted to sunlit terrain, which at high latitudes corresponds to the summer seasons.
That being said, Odyssey is now collecting more off-nadir images than it ever has. As part of our efforts to do different things with the spacecraft and instruments in the extended mission, we have made the off-nadir pointing process more routine, and now do it about once a day, on average. This has allowed us to recently fill in the north polar gap and we intend to do the same in southern spring and summer. It also allows us to look at the same target several times in a week to look for short-timescale dynamics, in both the visible and infrared bands.
As for the gap in 2007, it is precisely 3 months long -- the length of time corresponding to a single data release -- and it now appears there's a problem with the archived metadata for that particular release period. I'm talking with folks responsible for the data archives about getting that fixed.
As an appendix, I thought I'd explain how I got the data for that chart, in case there are any readers out there who want to explore metadata for THEMIS or any other spacecraft instrument. Googling for THEMIS data brought me to this page at the Geosciences node, which led me to the THEMIS Data Node. The data set seemed to come in two flavors, SDP and GEO. Poking into the most recently updated folder and checking the readme file, I saw that the files that I wanted were "ODY-M_THM-5-VISGEO-v2.0", which are images taken in visible wavelengths that have been spatially registered to the Martian surface. I wanted to see how the local time of day on Mars when the images were taken has changed with time. For that I need a file that has some metadata for all of the images. The PDS provides those in the index folder of a data set. Reading the idxinfo.txt file that I find in there, I see I'm looking for the file THMIDX_VIS, which should be a cumulative index table for all THEMIS visible observations released to date. When I download THMIDX_VIS.TAB (careful, it's 83 MB), I also need to download THMIDX_VIS.LBL, which tells me what all the column headers in THMIDX_VIS.TAB are. I put the column headers on the columns in Excel and started playing with graphs.


 Explore Worlds
 Find Life
 Defend Earth


