Emily Lakdawalla • Oct 14, 2015
Favorite Astro Plots #2: Condensation of the solar system
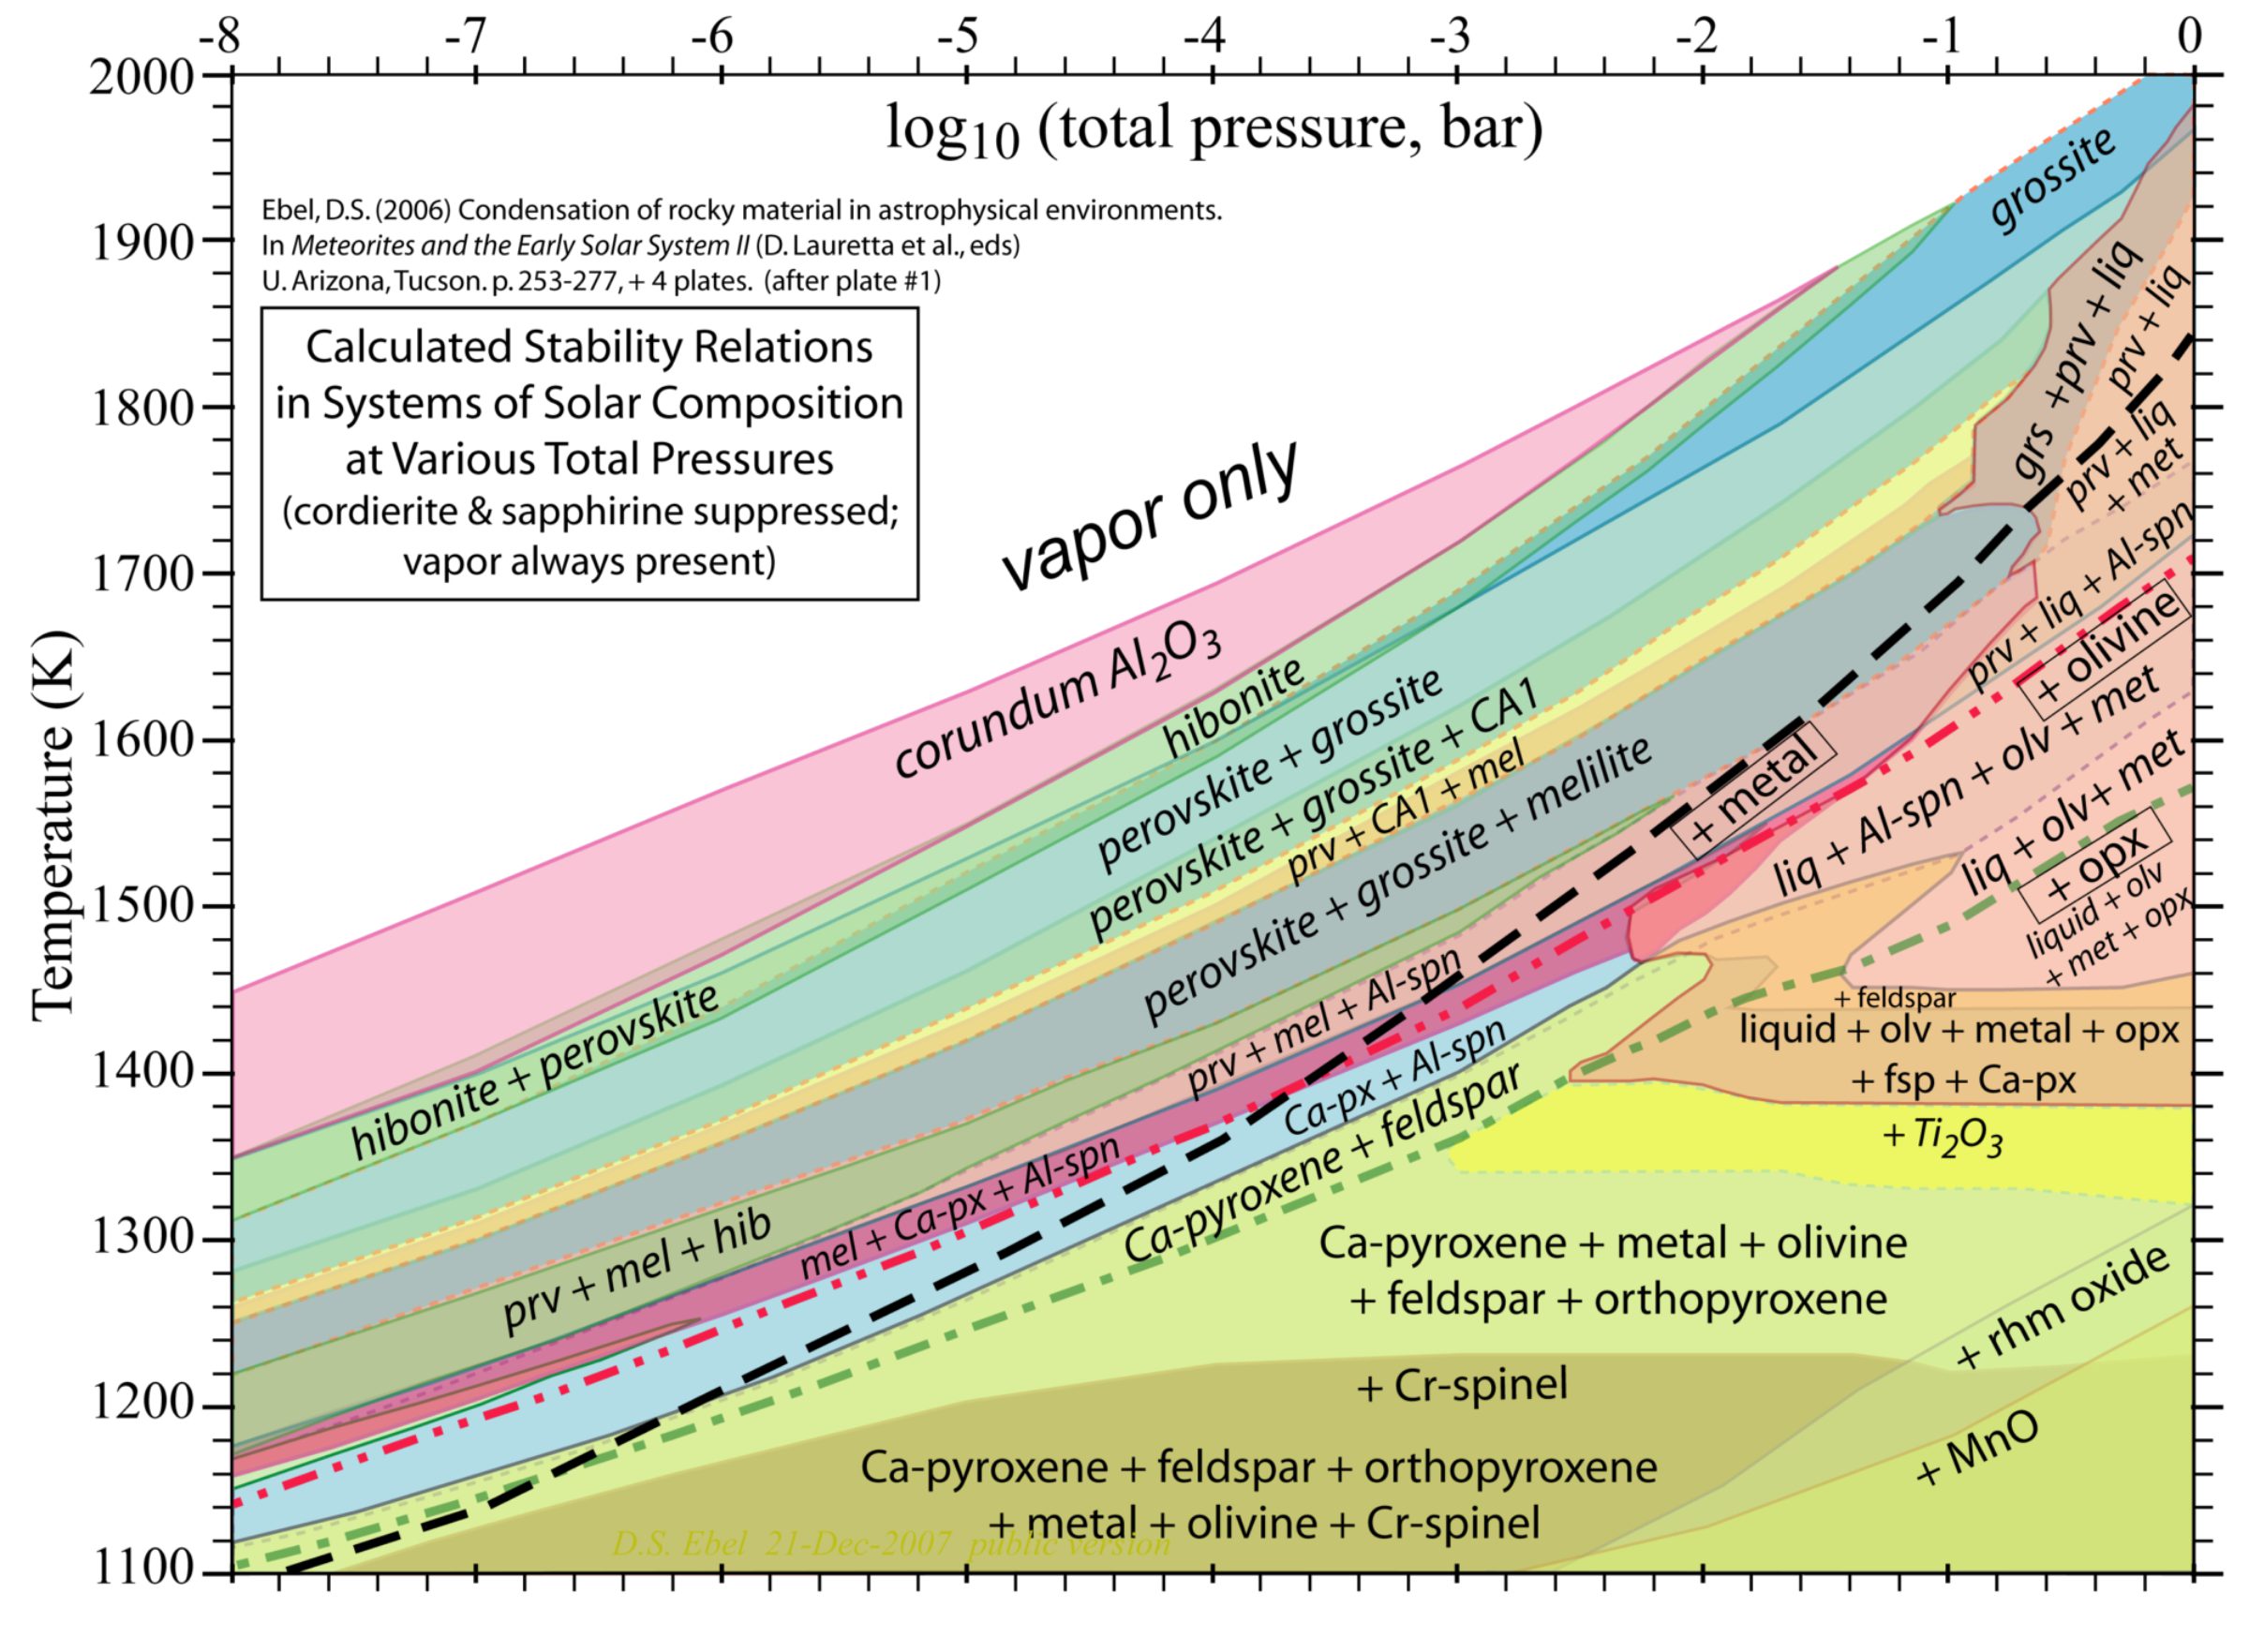
Behold: the story of how our solar system began, in one chart. This is the second installment in a series of planetary scientists' favorite plots. Today's plot was suggested by spectroscopist Michael Bramble, from Brown University. The colored fields on this graph bear the names of a variety of different minerals; a heavy black dashed line is labeled "+ metal". What does it all mean?

Five billion years ago, there were no planets and no Sun. There was only an interstellar vapor, with nuclei of this and that element zipping one way and another, and rarer grains of dust. We think of space as cold, but the sparse atoms that "empty" space contains are moving very, very fast. Today, the temperature of our "local cloud" is several thousand kelvins, and the temperature of the "Local Bubble" in which our cloud is immersed is about a million kelvins. With extremely high relative speeds and rare encounters, the atoms in space are inclined to stay as a vapor. That vapor is the white area at upper left of the diagram: very high temperature, very low pressure.
Something happened that locally increased the density of the cloud just a bit, and gravity caused it to begin to collapse, increasing its density, pressure, and temperature. Our Sun formed, and it got hotter. It got hot enough that most of the preexisting dust also evaporated to vapor. We're still on the upper left area of the diagram.
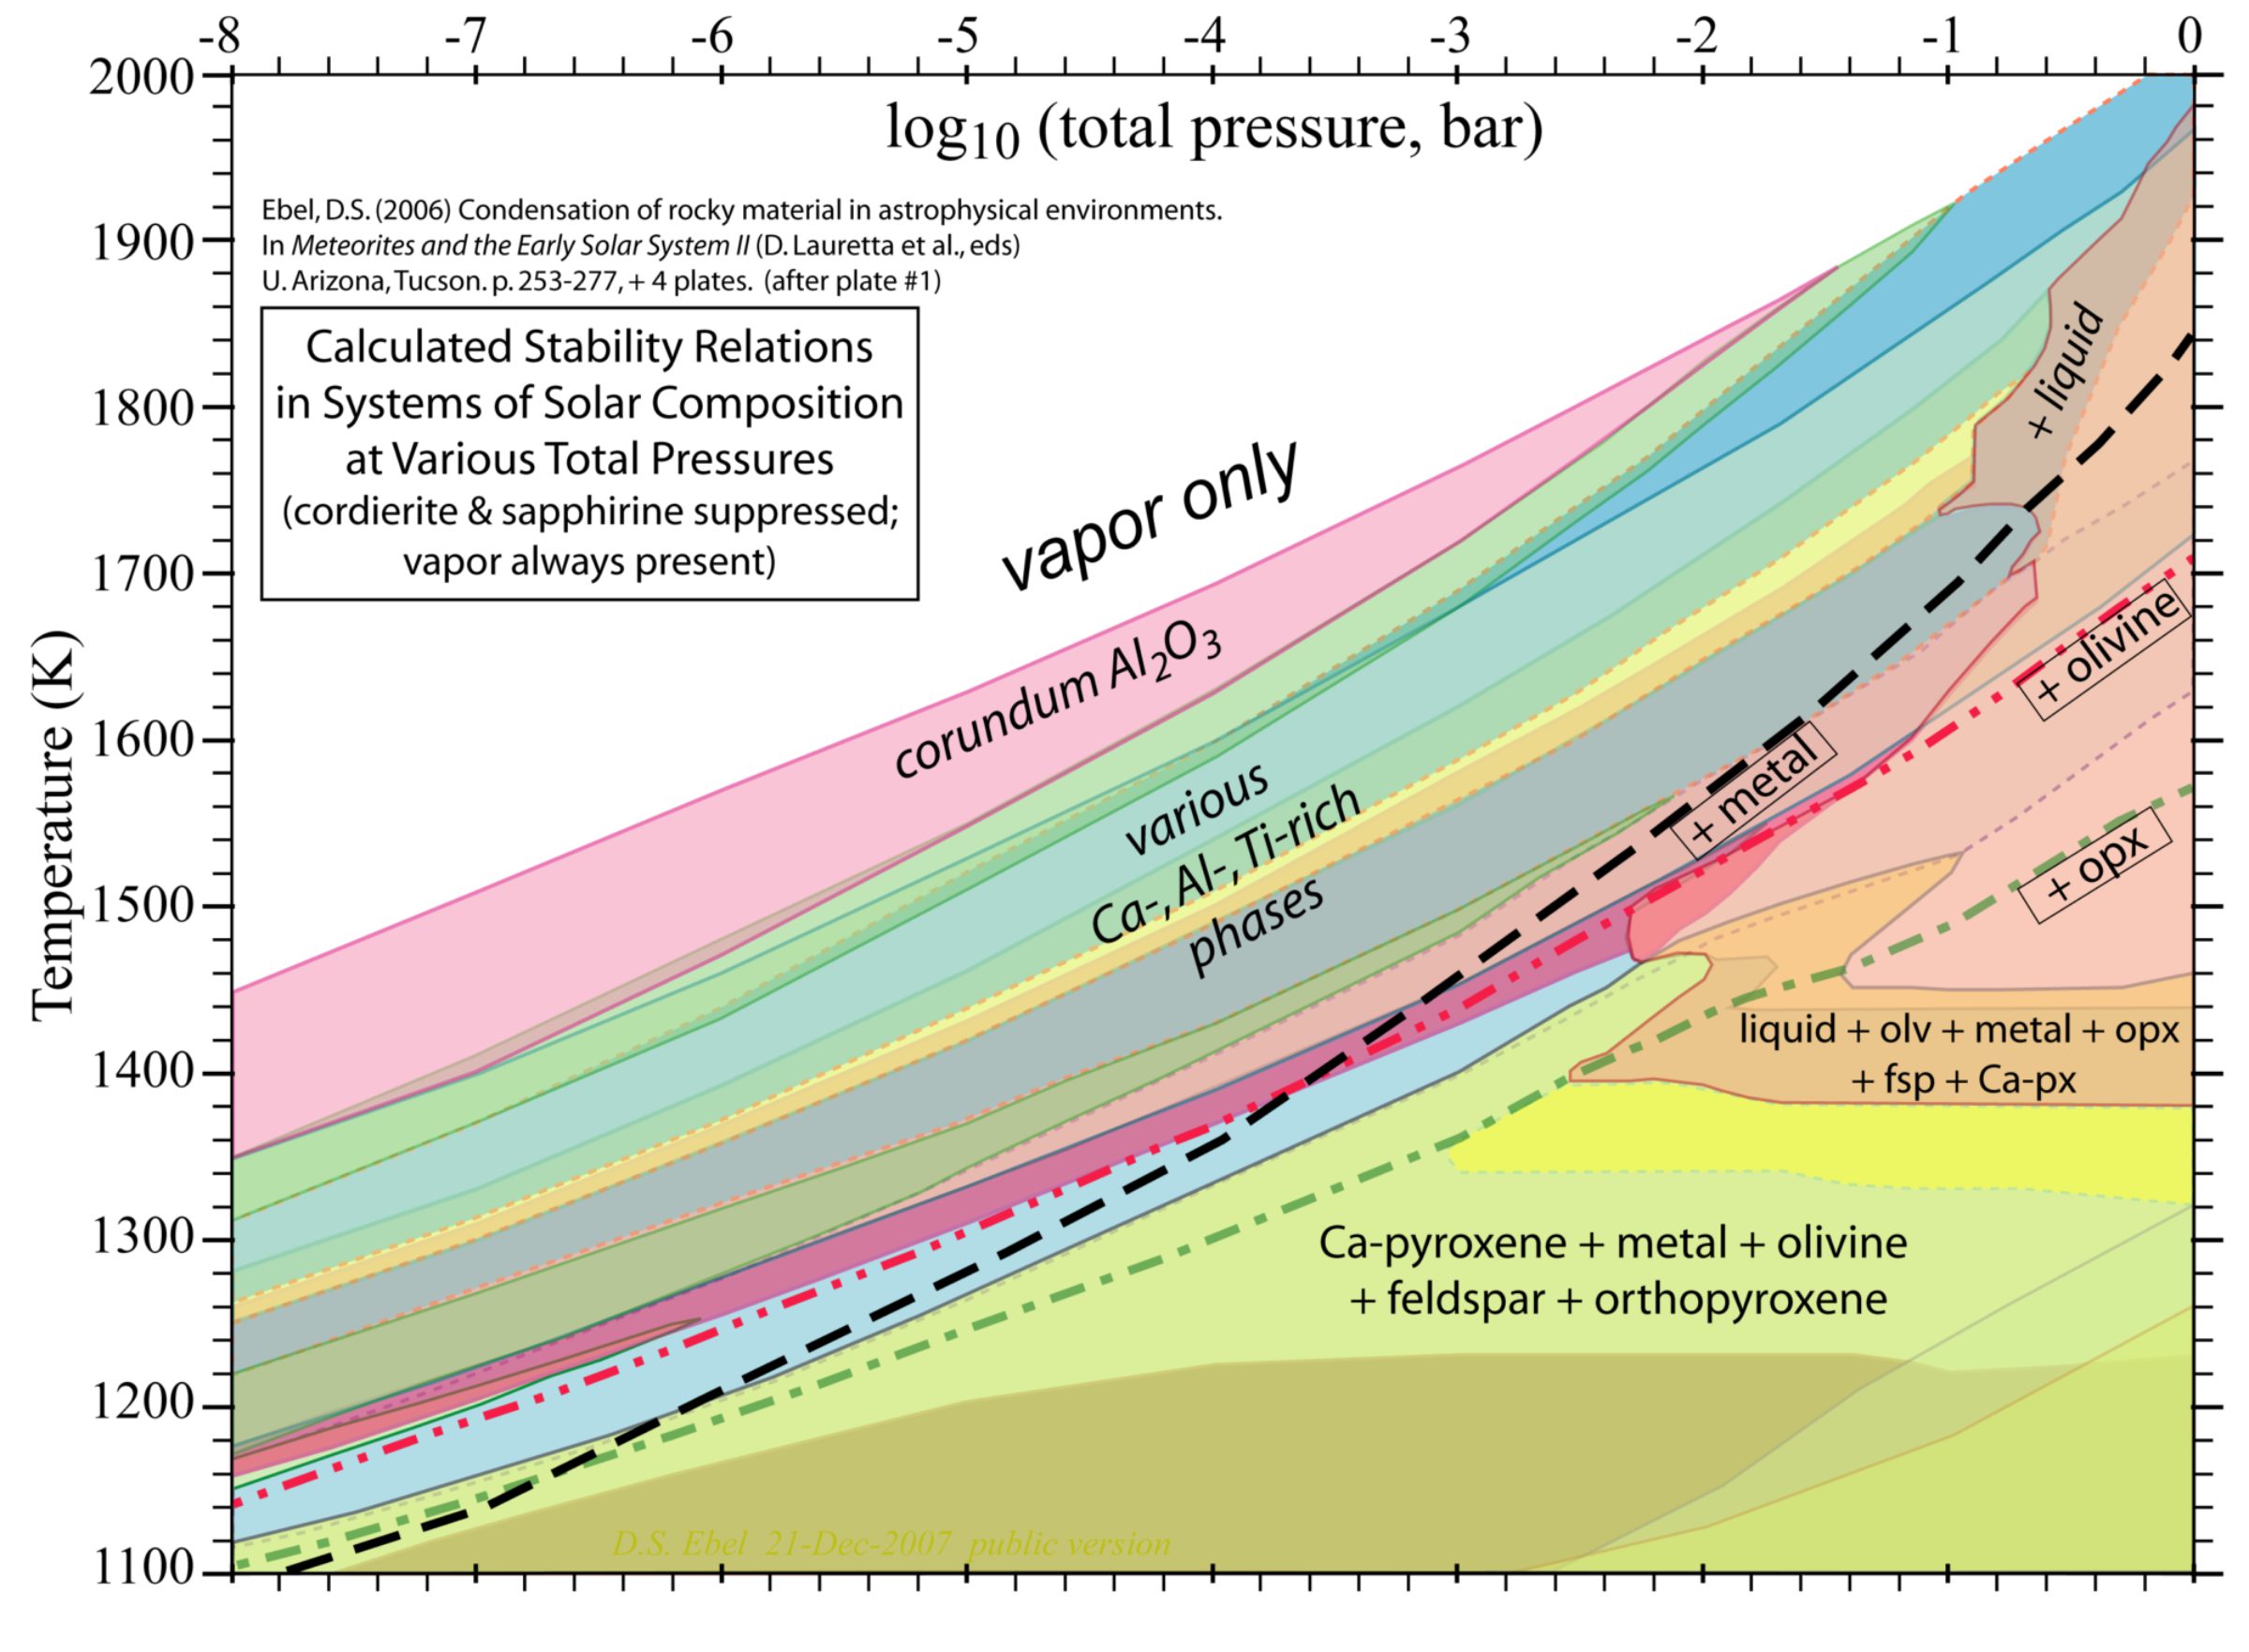
Eventually and inevitably, things cooled, and wherever the density was high enough, mineral grains began to form. "There's always a sort of ethereal excitement surrounding the first solids of our solar system," Bramble wrote to me. "Examining the figure shows that at high temperatures and low pressures a vapor is all that exists, but as the temperature of the protoplanetary disk cools and the pressures increase, minerals begin to form." Start in the upper left area, and let your eyes follow a trajectory down and to the right, as pressure increases and temperature cools. Bramble went on: "The first mineral that should condense would be corundum, and hibonite next as the nebula cools and condenses. The highly refractory elements (Ca, Al, Ti) condense from the vapor first, then the moderately refractory (Si, Mg, Fe), and so on." It may help understanding to look at a simplified version of the diagram, generalizing the mineral names:

Bramble explained to me why he chose this as his Favorite Astro Plot:
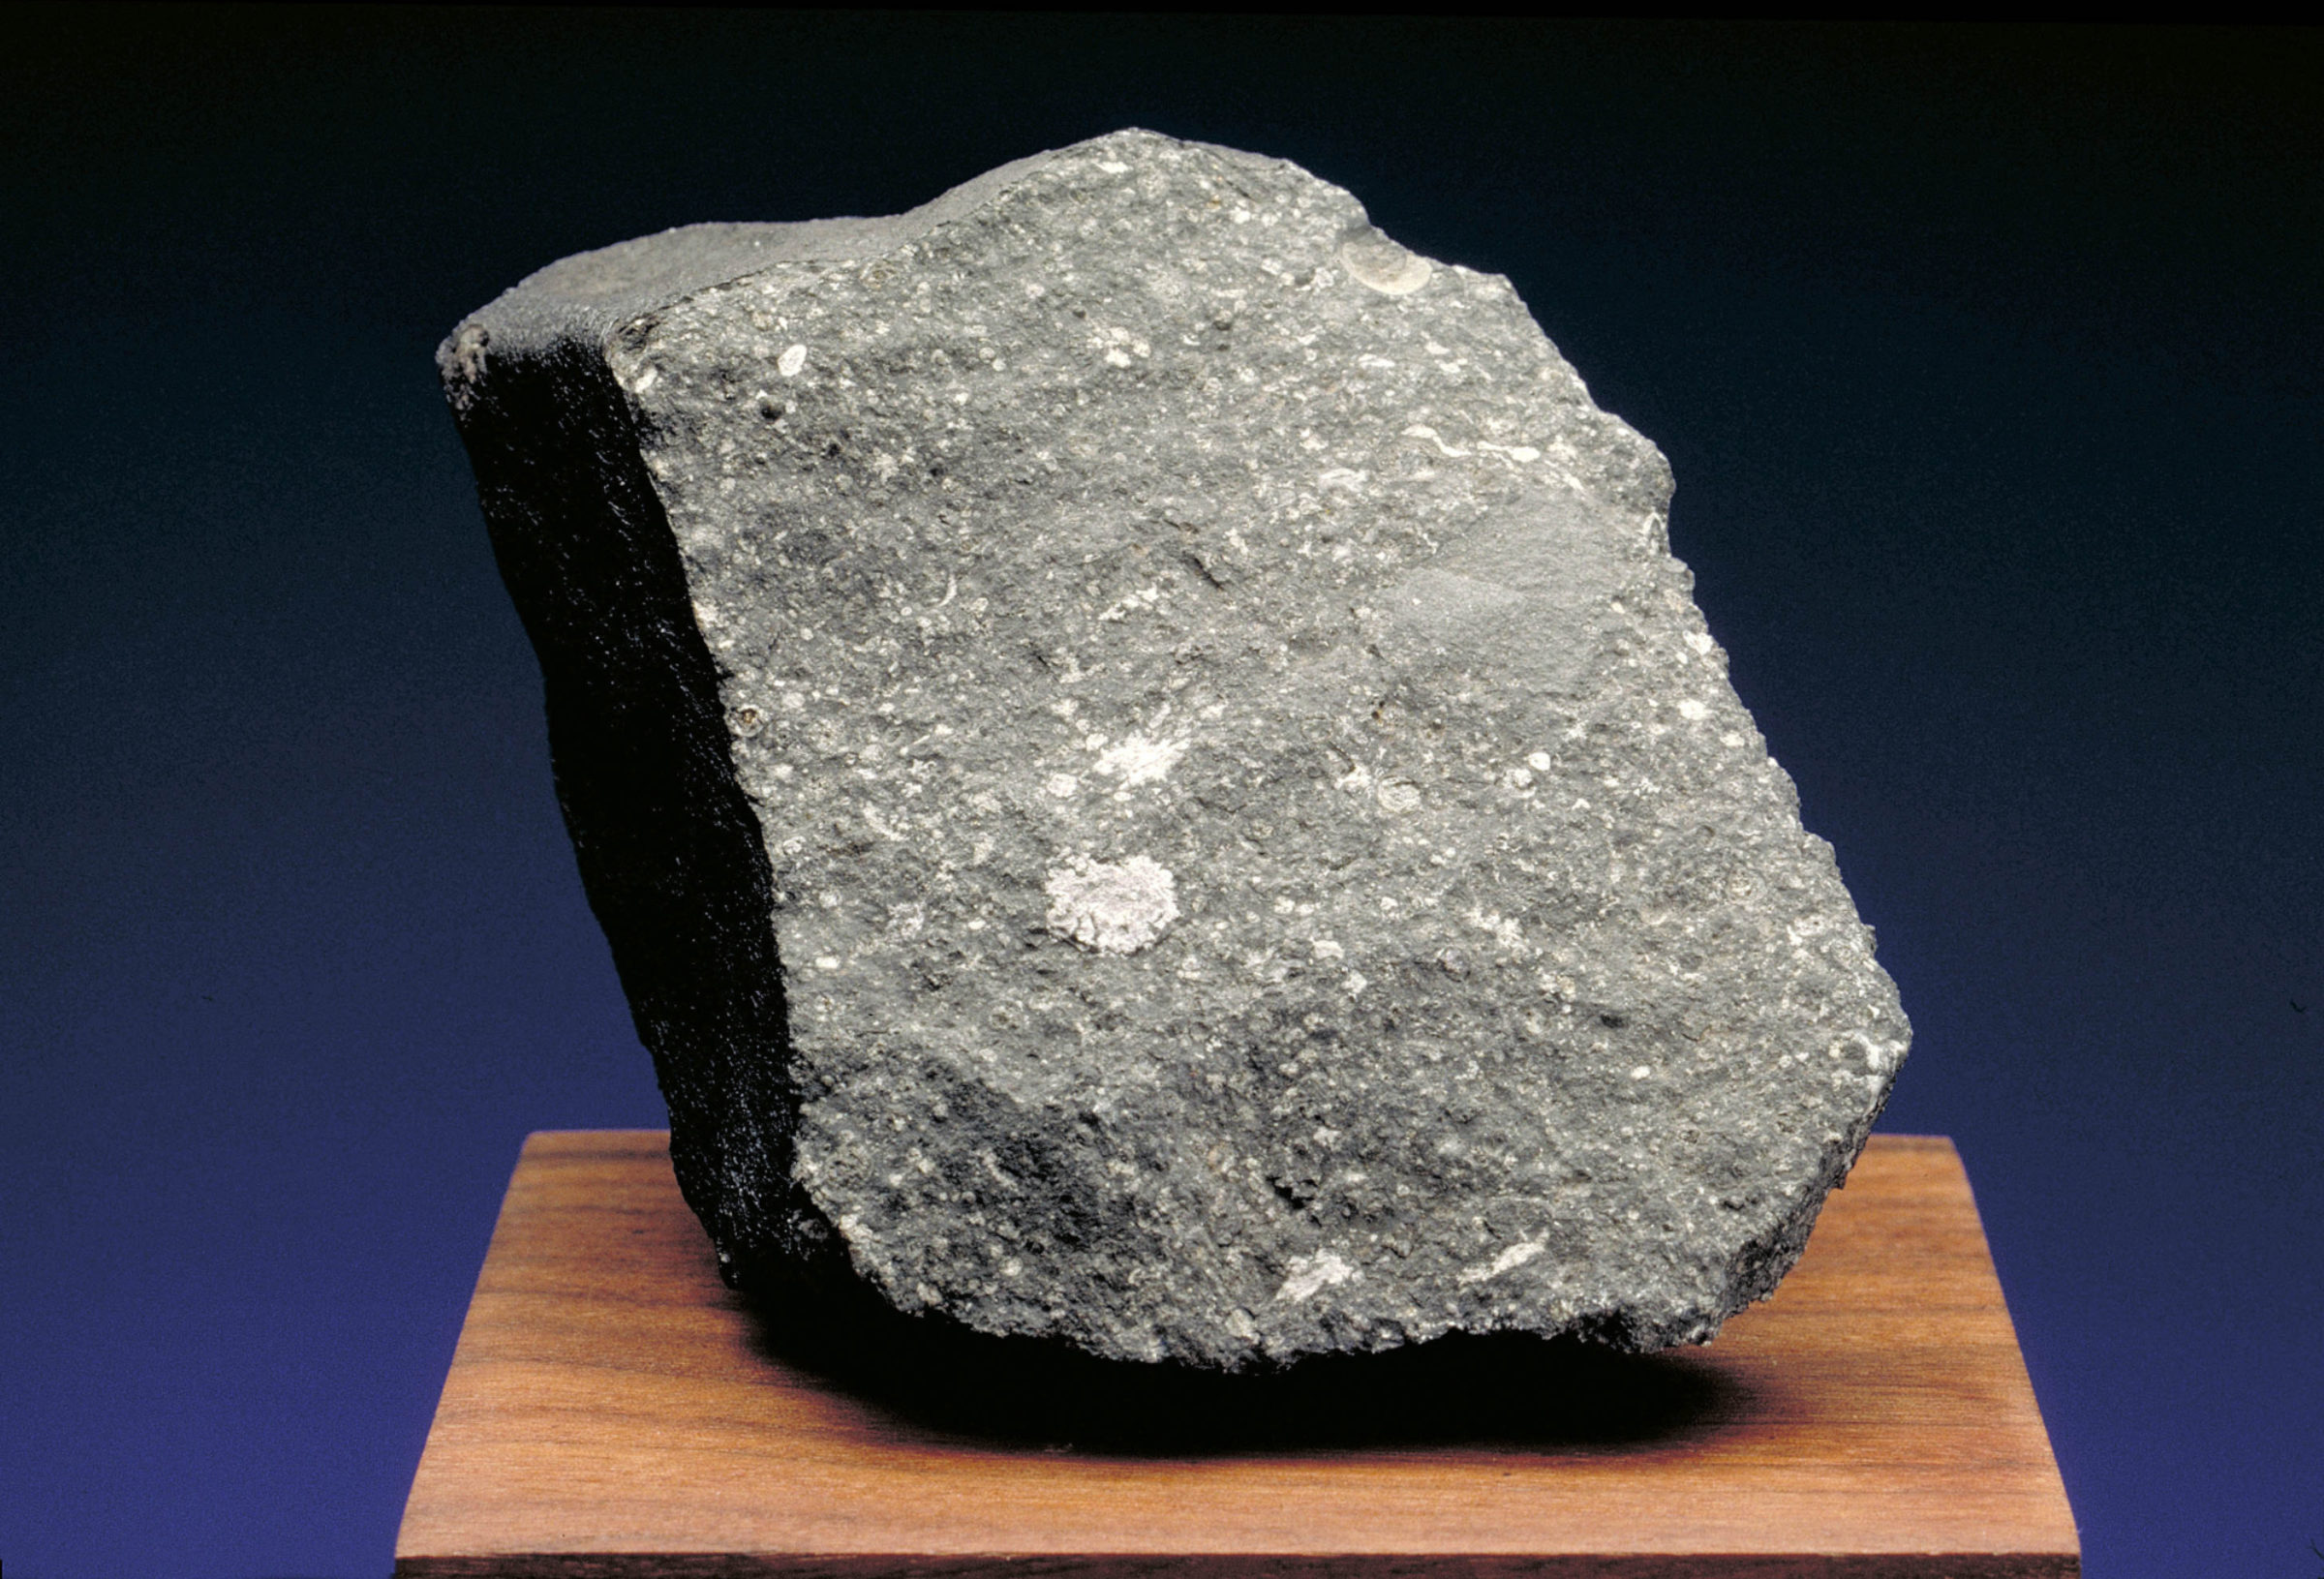
This plot is used in ongoing research for studying the timing of events in solar system formation. It allows for the mineral assemblages observed in meteorites and asteroids to be tied back to both the pressure and temperature at which they formed, and also the potential formation sequence. For example, the refractory calcium-aluminum inclusions found in meteorites have high abundance of calcium- and aluminum-rich minerals (e.g., corundum or spinel) and therefore suggest they are remnants of the first condensates from the solar nebulae. Similarity, chondrules in chondrites have minerals such as olivine and pyroxene suggesting they formed at cooler temperatures, and so on for the matrix minerals (phyllosilicates, sulfates, carbonates). So this figure shows us the evolution of solid materials during the birth of our solar system. As the disk cooled, different minerals formed at different times, and as a result we have a potpourri of different mineral phases observed in meteorites that we can tell formed at different times and temperatures, despite now being seen side-by-side in the same rock. This figure allows this entire evolutionary story of solar system solid materials to be depicted in a single image.
A few other interesting things you can see in the diagram: the dashed line, running on top of all the mineral names, shows at what temperatures and pressures metal will precipitate. Metal and silicates are immiscible; they form distinct blebs in meteorites. Toward the upper right, you can see a zigzaggy line where the temperature gets so high that the solid minerals begin to melt into mixtures of some solid minerals plus a liquid. You can learn more about the diagram through the links on Denton Ebel's VAPORS project website.
Thanks, Michael, for sharing your favorite astro plot! If you're a researcher who'd like to tell me a story about a favorite plot of yours, send me an email!

Support our core enterprises
Your support powers our mission to explore worlds, find life, and defend Earth. You make all the difference when you make a gift. Give today!
Donate

 Explore Worlds
 Find Life
 Defend Earth

