Emily Lakdawalla • Jun 05, 2014
How CRISM picks the pixels that guide Opportunity's travels
I've fallen down a research rabbit hole again, so grab a snack and get comfortable. The question that led me on my chase is: When will Opportunity get to the clay minerals that her scientists seek? They examined some at Cape York, but then set off southward...with what goal? The short answer is that Opportunity is now right on top of one of the clay sites picked from orbit, but has yet to reach another interesting spot about 2 kilometers further south. (You would have read the same answer in today's MER Update from A. J. S. Rayl.) The long answer takes me through a couple of years of scientific research and the development of a new trick for an old spacecraft.
First, here's a map, showing the locations of the clay minerals that have been detected from orbit. This is the information that is guiding the Mars Exploration Rover mission's choices of where to send Opportunity. It may be a little hard to see the colorful spots that mark the clay mineral locations. They are very small, in most places spanning just a couple of pixels on this map. Opportunity drove 12 kilometers over three years to see what was really in those pixels, and has now spent nearly three years exploring the crater rim that contains them. Slide the green slider back and forth to see how Opportunity's traverse fits in to the picture.
Let's start with a little mission history. Back in September 2008, after wrapping up work at Victoria crater, the Opportunity team considered what new kind of exploration could justify years more of work on Mars. Victoria crater had given them their best window into the sulfate-rich layers of the Burns formation; studying the Burns formation some more would not, on its own, be a compelling goal for another extended mission.
During the time that Opportunity had explored Meridiani Planum, a revolution had been taking place in our understanding of Mars' geologic history. Evidence from the Mars Express mission suggested that Mars' global water chemistry had shifted with time. The planet's present phase was dry, with severely oxidizing soil chemistry. Before that, Mars had had a marginally wetter period, with acid groundwaters depositing sulfate minerals. And before that, there was a more clement Mars, with more abundant water creating clay minerals. Mars Reconnaissance Orbiter arrived two years after Mars Express, and data from its instruments backed up the Mars Express findings. (For more about how these different minerals speak of different past environments on Mars, read this post about Mars' geologic history.)
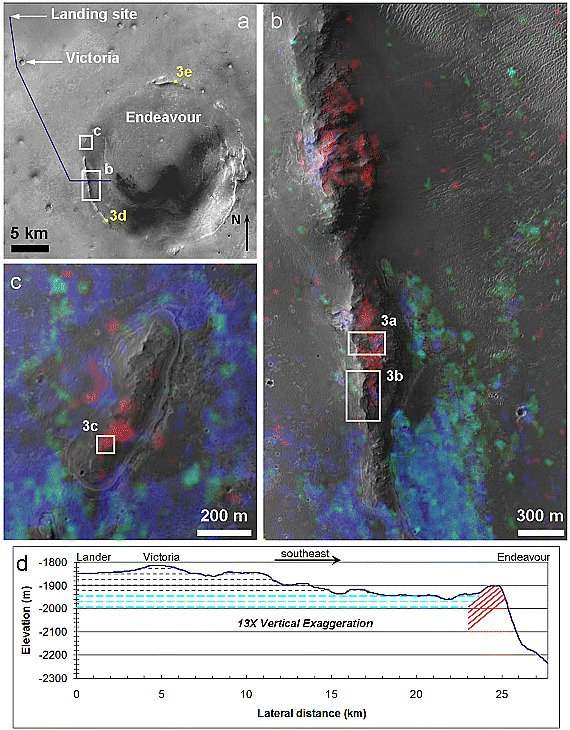
From her landing site to Victoria crater, Opportunity had explored modern and middle-aged environments, but had not seen clay-rich rocks from Mars' most ancient time. The mission looked to the rim of a large crater, formed during the earliest part of Mars' history. Using data from Mars Reconnaissance Orbiter's Compact Reconnaissance Imaging Spectrometer for Mars (CRISM), James Wray and coauthors saw evidence for clay minerals there, on and around the rim of the crater. Here's the paper: "Phyllosilicates and sulfates at Endeavour Crater, Meridiani Planum, Mars." (Since it was published in an AGU journal more than two years ago, the article is free for all to view.) I wrote an explainer about the Wray et al. article in 2010. "Phyllosilicates" is a term for platy minerals that includes a class of minerals that are informally called clays.
Here is the key figure from that article, the one that led the Mars Exploration Rover team all the way to Endeavour:
A couple of years after that figure was published, I noticed that the Opportunity team started using a different one for the region of Endeavour's rim called Cape York. Instead of the multihued splotches representing different kinds of minerals, there is one crisp spot of bright red, labeled only "smectite." Smectite is a kind of clay mineral.

This diagram was formally published only this year, in a Science paper about the work done by CRISM and Opportunity working together to identify ancient watery environments preserved in Endeavour's rim at Cape York by Ray Arvidson and a host of coauthors. I thought this map was produced by a method similar to the Wray et al. one. But it turns out to be quite a different animal.
To begin with, the map is based on data acquired with a new technique for CRISM, one that the CRISM team began using in 2010, to try to achieve higher resolution. In its native mode, CRISM manages about 18 meters per pixel. This is the best of any imaging spectrometer ever sent to Mars, but it's still a much larger spot than the scale of outcrops Opportunity is exploring. Both Mars Express OMEGA and Mars Reconnaissance Orbiter CRISM had shown us that finer resolution yielded more discoveries of water-related minerals, because those minerals tended to be in the most ancient rocks, most deeply buried, least well exposed. The smaller your pixels, the more of the pixel will be made up of the elusive patches of mineral you're looking for, so the stronger the signal. It's not usually possible to get higher resolution out of an orbiting imager, but because of the peculiar way in which CRISM works, they were able to, using a technique called along-track oversampling.
From the very beginning, CRISM used a mechanical trick to achieve better-quality data than it otherwise might. CRISM is mounted to Mars Reconnaissance Orbiter on a gimbal. As the orbiter moves in its north-south path, the gimbal rotates CRISM in the opposite direction, compensating somewhat for the orbiter's rapid motion. That allows CRISM to stare at one spot on the ground for longer, receiving more photons and getting less-noisy data than it would if it couldn't gimbal. The gimbaling motion results in a characteristic "bowtie" shape to CRISM images -- they're narrowest at the point where CRISM is staring straight down, wider where it's pointing ahead and then behind the orbiter along its ground track.
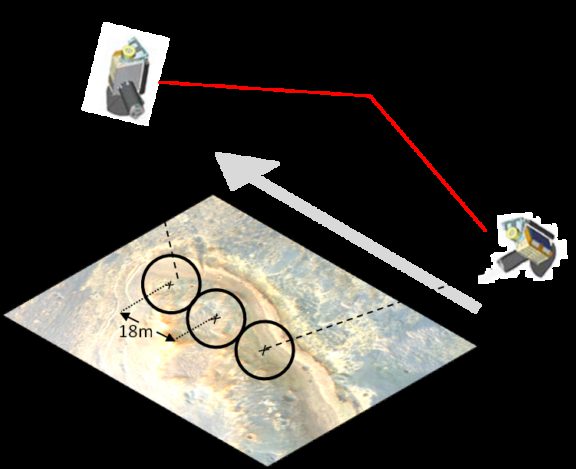
In along-track oversampled mode, they gimbal the instrument faster. The spot size of an individual CRISM pixel on the ground doesn't get any smaller, but the same spot is sampled in more than one pixel, and pixel centers are separated by less than 18 meters (in the diagram below, they're 11 meters apart).
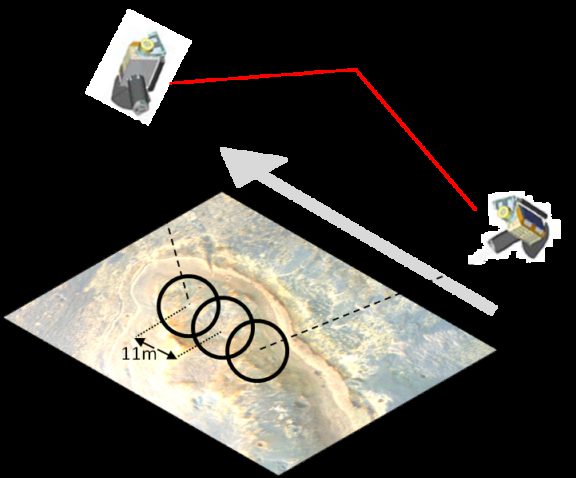
When the data come back, the pictures don't look all that pretty. They're stretched-out and wiggly. Features have been "oversampled" -- imaged more than once -- along the spacecraft's roughly north-south track. Other mechanical motions of the spacecraft introduce those horizontal jiggles.

To turn these into pictures, they have to correct for the various motions of the spacecraft and gimbal to figure out where each pixel was actually centered on the ground, mapping each pixel to a specific location. With that information in hand, they can spit out a map like this one:

You can still see the traces of the individual CRISM pixels in this map. At each one of those locations, there is a CRISM spectrum -- a graph of how much light is reflected from a spot on the surface with respect to wavelength. In order to find clay minerals, scientists like James Wray and Ray Arvidson look for telltale wiggles in the spectrum. A dip in the spectrum at a specific wavelength can be diagnostic of a specific mineral. Here is some laboratory-derived data on what three clay minerals look like at wavelengths visible to CRISM. The three minerals are all smectites, but they contain different metals. Nontronite and saponite contain iron and magnesium, respectively, but montmorillonite has neither, only aluminum.
At this point you might be wondering why we care which specific clay mineral is present in a rock. It's because the specific composition of minerals can tell mineralogists a lot about what that rock went through on its way to becoming the rock we see today. Most stuff on Mars has essentially the same bulk composition (proportions of different kinds of elements), but those elements are arranged in different ways into different minerals depending on the rock's history. So by identifying the minerals present in a rock, you get clues to the rock's story. For example, clay minerals usually involve water in their formation. If a lot of water has been flowing around, the water can leach out and carry away some of the elements that were once present; a rock that started out with lots of iron and magnesium can lose those metals, but the less-soluble aluminum is left behind.
If the CRISM data are very well-behaved, you can process them into images that are maps of places where there's a dip in a spectrum that corresponds to specific minerals. For instance, if you look at the spectrum above, you can see that the spectrum of nontronite has a deep dip at a wavelength of about 2.29 microns, while all the different spectra are bright at about 2.35 microns. So to look for nontronite you might take the CRISM image at a wavelength of 2.35 and divide each pixel by the corresponding one in the 2.29-micron image, and wherever the resulting image is dark, you might say you detected nontronite. Actual CRISM analysis is much more sophisticated than this, relying on much more of the spectral data than just two discrete wavelengths, but that's the basic idea of how you can create maps of mineral distributions from spectral images. It's this kind of image analysis that yielded the maps that Wray et al. published in 2009.
Unfortunately, the data are not always that well-behaved. Even in 2007, when CRISM was still "young" and getting crisp data, coherently mapping the distribution of clay minerals was marginal (I wrote about this in a 2007 blog post -- third paragraph from the bottom). The problem is that no rock will be 100% one mineral; most rocks are mixtures. And, of course, CRISM pixels are large compared to most rock outcrops. So the amount of clay present in an individual CRISM pixel is typically very small, even with relatively clay-rich rocks present. The clay mineral will have a correspondingly small effect on the overall shape of the CRISM spectrum at that pixel, barely above the noise background. And now CRISM is getting less sensitive as it ages. CRISM, like many infrared sensors, needs to have a very cold detector to reduce the noisiness of the data. But CRISM's detector cooling system is not as effective as it once was. The difference is small -- the detector was 6 degrees Celsius warmer for the newer, oversampled observations compared to the ones used in the Wray et al. work -- but it makes the CRISM data from wavelengths shorter than 2 microns too noisy to be useful, Ray told me. In fact, they're only looking at a pretty narrow slice of the CRISM wavelengths, between about 2 and 2.5 microns. Here's what a single CRISM spectrum looks like in one spot on Cape York.

You can tell that there are dips in this spectrum, although they are tiny, amounting to barely 1% of the reflectance (check out the Y axis on the graph). If you look at the laboratory data, you can tell that nontronite, the iron-bearing clay, is probably present, from the dips at 2.28 and 2.4 microns. Indeed, they could reproduce some of the shape of this spectrum with a mixture of mostly basalt and a little bit (5%) of nontronite.
But the data are a little noisy and the absorption bands weak, so image analysis does not yield pretty maps. Ray now thinks that the Wray et al. maps are not real detections, but are instead noise. That doesn't mean there's no clay present, however; it just means they need to approach finding the clay in a different way. Instead of doing image processing to create mineral maps, Ray told me that they searched for outcrops containing clay minerals on the rim of Endeavour crater by inspecting the individual spectra and identifying which pixels appeared to contain the signatures of clay minerals. That's why his new map of smectite at Cape York just contains a few colored-in pixels, and why this as-yet-unpublished map of the clays at Murray Ridge and Cape Tribulation look like that, too.
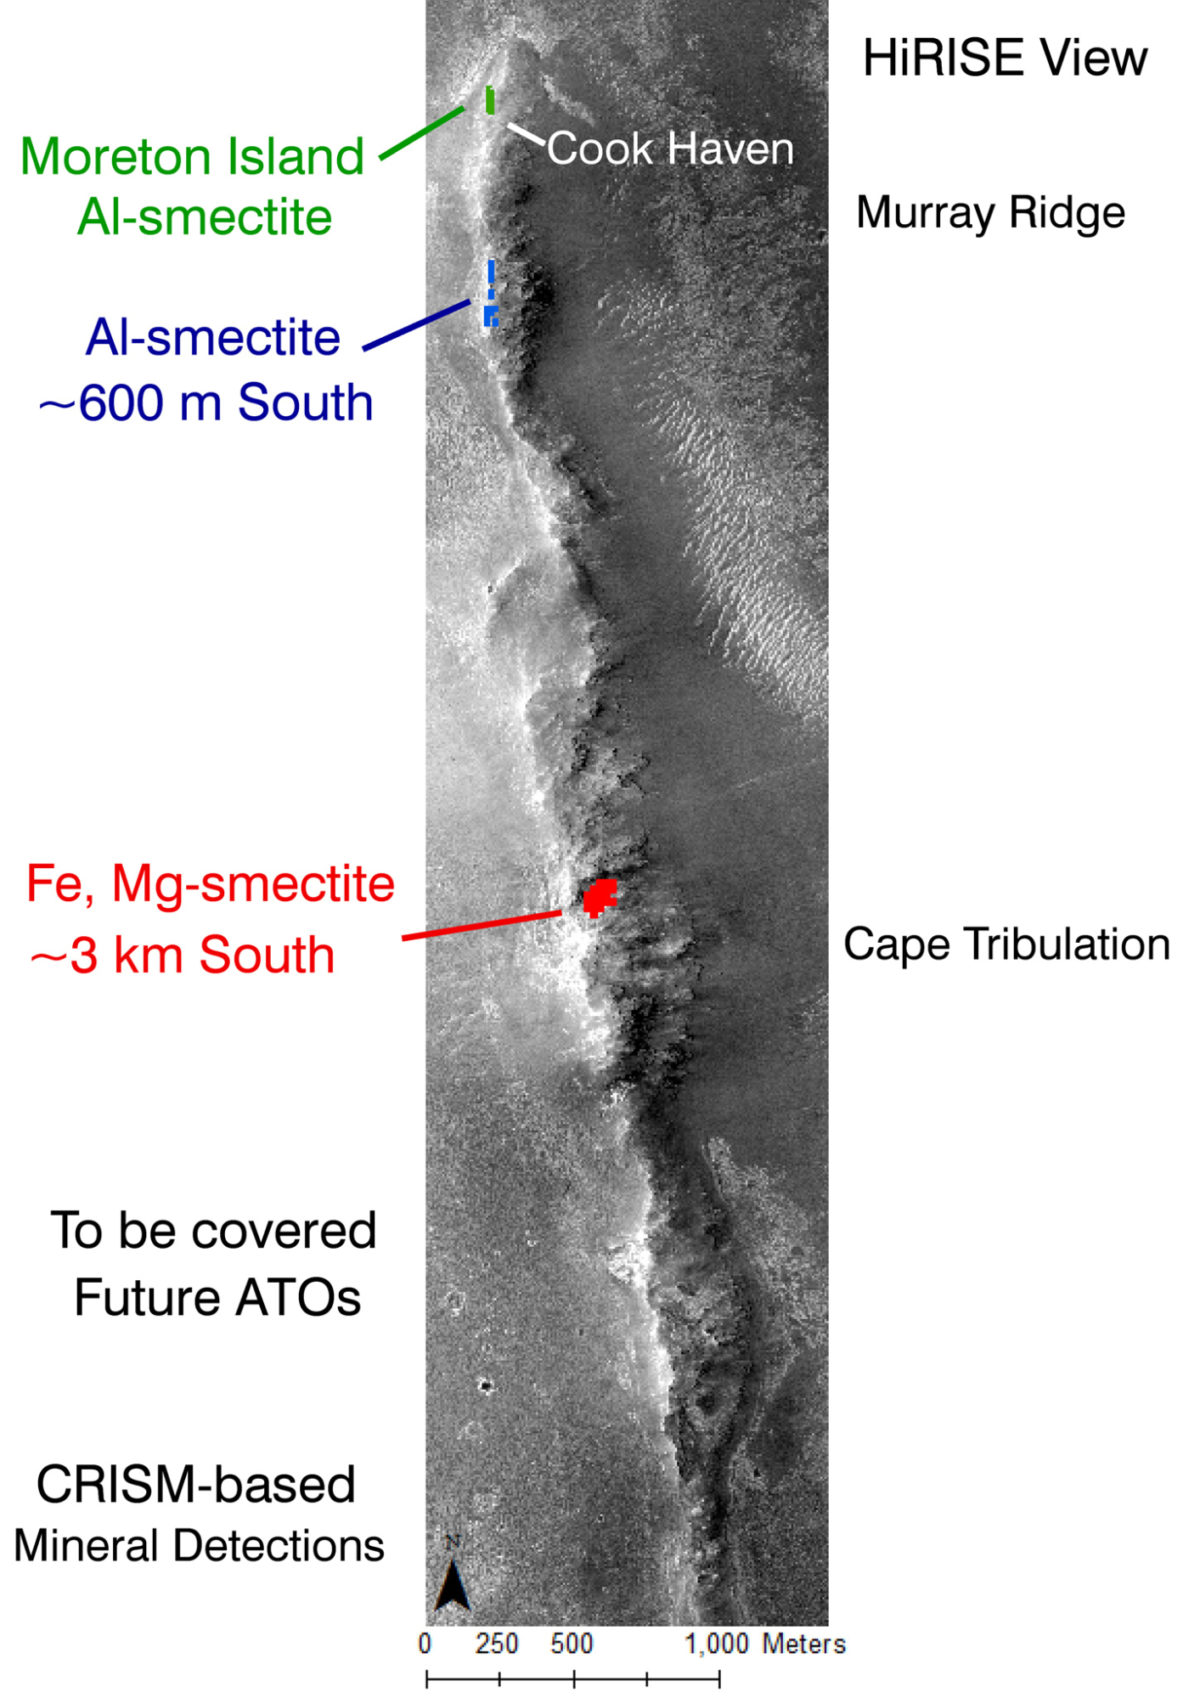
Opportunity is now exploring the aluminum-rich clays at Pillinger Point. Today A. J. S. Rayl reported that they plan to study those rocks for probably the whole month of June. It's nice that we'll be here for a while, because the view is lovely.

Support our core enterprises
Your support powers our mission to explore worlds, find life, and defend Earth. You make all the difference when you make a gift. Give today!
Donate

 Explore Worlds
 Find Life
 Defend Earth