Emily Lakdawalla • Feb 08, 2013
Browsing Landsat data is a lot easier than I thought it was
With the Landsat Data Continuity Mission (otherwise known as Landsat 8) scheduled to launch on Monday, there's been a lot of Tweeting about Landsat, and through one such Tweet I learned about a resource that I hadn't known existed before: the LandsatLook Viewer. This is a graphical interface to more than a decade worth of Landsat data, a tremendous resource for anyone interested in Earth's changing surface, natural or manmade. I haven't done much with Landsat data lately, but it's the very first kind of satellite image data I ever processed, and I'm thrilled to find that LandsatLook puts it at my -- and your -- fingertips.
Landsat is a long series of satellites that have orbited Earth since 1972. All of them have carried similar camera systems, which means that they have established a continuous record of the changing face of Earth over those forty-plus years. Most Landsat image data are medium-resolution, at about 30 meters per pixel. This is too coarse to see most buildings, but it's fine enough to see patterns of land use, and it's a resolution at which you can achieve repeated global coverage.
Landsat data is also multispectral. What does that mean? Landsat views Earth in seven wavelength regions, called "bands." Just like I routinely do with Cassini or Voyager image data, you can use any three Landsat bands to make a color picture. With red, green, and blue bands, you can get a picture that looks like the view out a space station window. But, again, like most space cameras, Landsat's imaging capability stretches into the infrared. On Earth, relative infrared brightness at different wavelengths can tell you about vegetation health, soil moisture, and rock type, among lots of other things.
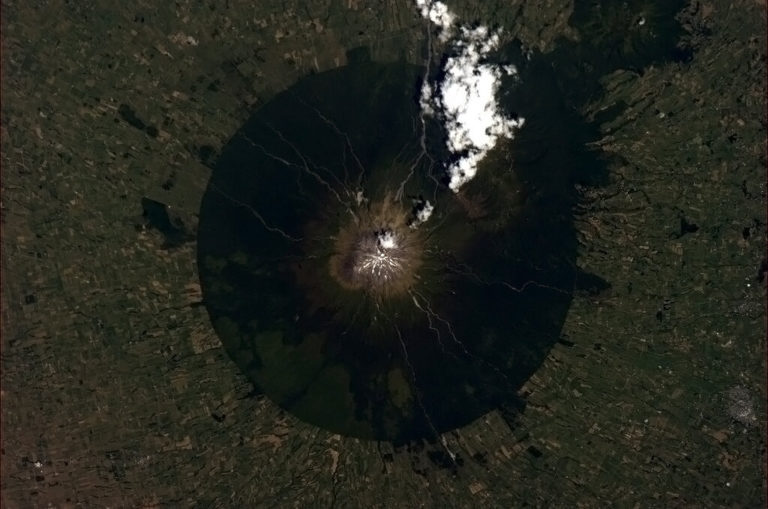
I wanted to try out LandsatLook; but where on Earth should I pick? That decision became easy when I saw a photo that Space Station astronaut Chris Hadfield Tweeted yesterday. (Incidentally, astronauts on the Space Station Tweeting photos shot out their windows is among the top reasons I love Twitter.) "The Taranaki Volcano looks too perfect to be real," Hadfield commented. Of course, that perfect-circle boundary is no accident; it's the result of New Zealand establishing a National Park covering everything within a 6-mile radius of the peak.

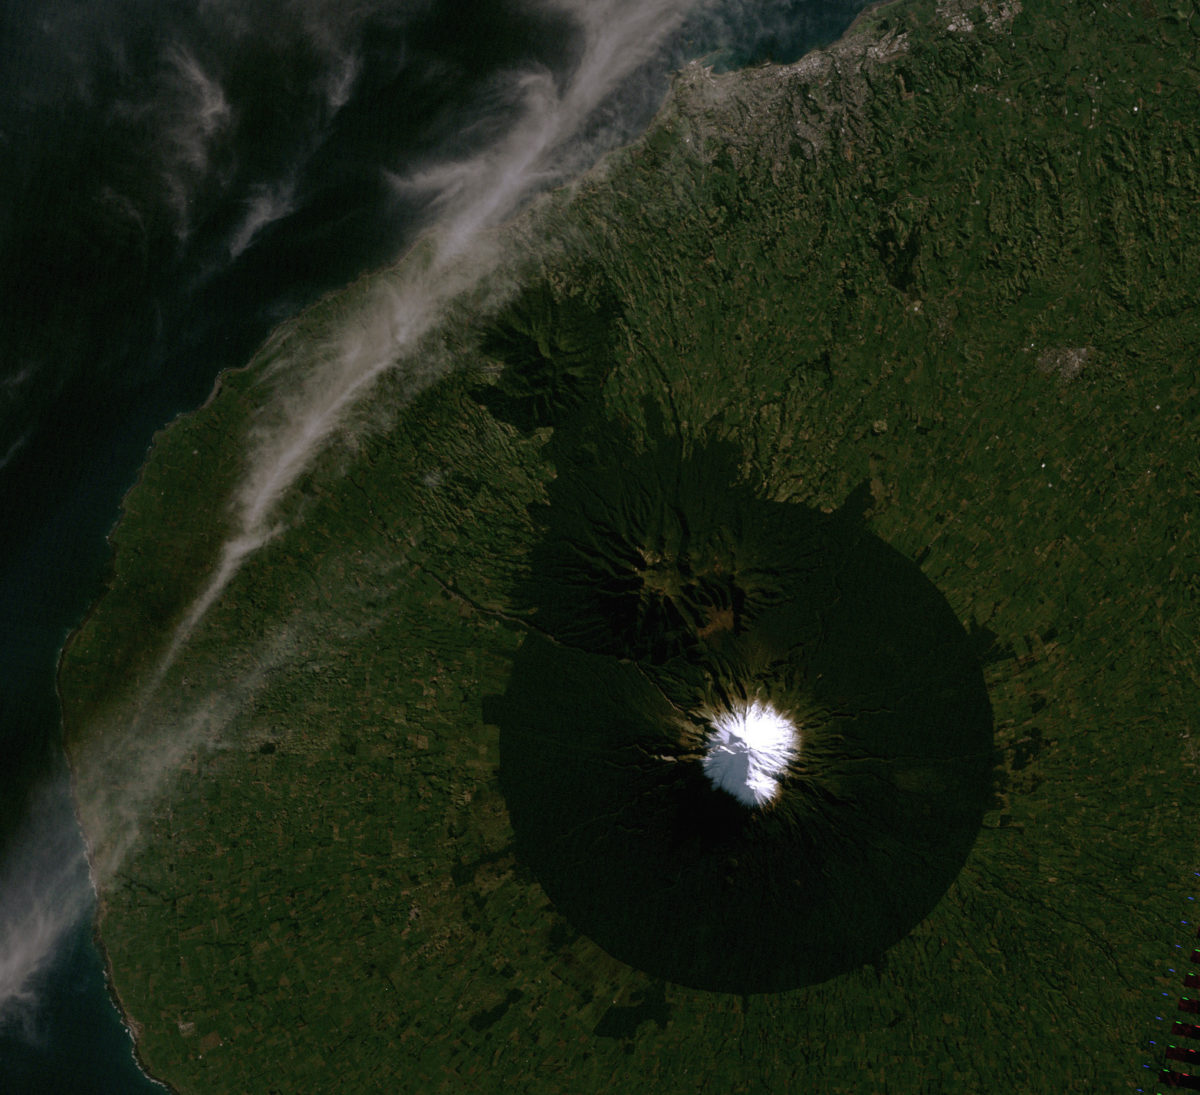
So I went to LandsatLook to see if I could find Landsat imagery of Mount Taranaki. Here is a view of the same volcano from Landsat. This one was taken about eight years ago, on June 15, 2005. This being the southern hemisphere, it's winter, and the mountain peak is covered in snow. I'm thinking I'd like to add a bunch of Landsat images to my space images database, showing Earth geologic features -- volcanoes, deltas, faults, that sort of thing. I'll have to find slightly less vegetated areas than this verdant spot in New Zealand if I actually want to see the geology!

It was very easy to browse the data across both geography and time in LandsatLook, but there were quite a few steps to retrieving it, and even more to make a true-ish color photo that looks like the one Hadfield took. If you're interested, here's a walkthrough of how I made that image, and an interesting pitfalls I fell into along the way.
I put "Taranaki" into the search field and LandsatLook took me straight to the right spot, on the west coast of New Zealand's North Island. I zoomed in tight on the mountain and clicked the big "select scenes" button. The database found 76 images, and showed me the most recent ones. Each Landsat image (colloquially called a "scene") is roughly square, and is 185 kilometers wide. (For Americans, that's about two Connecticuts stacked together; for Europeans, one Landsat scene covers about one and a half times the area of Wales.) So my 19-kilometer-wide volcano is way smaller than one scene, and I should only need one Landsat scene to see the whole thing. LandsatLook defaults to showing you as many images tiled on the view as are necessary to cover the whole window, but I was only interested in images where the whole volcano was in one image, so I clicked the "only one" button to make it show me one image at a time.
The first view had some cloud cover, so I scrolled back in time to find images that were less obscured by cloud. Each time I found one I liked, I clicked the "Metadata" button and added the image to my "cart." (Don't worry, there's no payment required here, whatever is available in LandsatLook is free of charge.) I could have exported the view directly from my browser to an image file, but if you know me at all, you know I want to see the original data. In the end, I found four that I liked, and I clicked the button to view my cart.
At this point there were quite a few hoops to jump through. You have to establish a username and password on the USGS website, and you have to download and install a little "bulk download manager" application in order to retrieve the data. The USGS website shows you a list of the images you've requested and you have to "Toggle All Bulk Download" and click "Apply" and then "Go to Item Basket." The next page shows you a list of the images you've requested. This is important -- you need to click the little down arrows to see what types of images are available. For three of my four images, there were only JPEG products available, what they call "LandsatLook 'Natural Color' Images" plus thermal infrared images. For one of my selected scenes, there was a "Level 1 Product" available. I selected everything that was available, then clicked "Proceed to Checkout" and then "Submit order." Then I had to run the Bulk Download Manager application, put in my USGS website login and password, select my order, select a target directory, and then click "Begin Download." Download was speedy, though, and soon I had my four scenes. The process really didn't take long, it just had a lot of steps.
I really wanted to use this photo of Taranaki, which was taken on January 13, 2010. At high summer, there was little shadow, meaning that all the color variation really is variation in color and not just different lighting conditions, and there was also very little ice on the mountain peak, laying bare its geology.
But this image just looked screwy. With those brilliant greens and the blue ice it didn't look right at all. Ice is bright across all visible wavelengths. But when I tried to make the ice white, I realized that the ice was darker than the vegetation in one of the color channels. When ice is dark and vegetation is bright, this is a clue that you are not looking at something in visible light. You are looking at it in the infrared. The chlorophyll that makes plants look green is very dark in visible wavelengths (that's chlorophyll's job, to absorb the commonest kinds of photons given off by the Sun and turn them into energy), but it is very brightly reflective in the near-infrared, just beyond the wavelengths that we can see.
So what exactly does Landsat mean by "Natural Color"? It's clearly not the same thing that I mean. A Google search quickly informed me that Landsat "Natural Color" is composed of Landsat bands 5, 4, and 3. These are centered at wavelengths of 1650, 830, and 655 nanometers, respectively. Those first two are infrared bands. Only the last one is visible light, and it's what I would call a red filter.
I'm not at all sure why they call this "Natural Color," but I can show you why this would be the default image type for Landsat. The main point of Landsat is to observe land cover, to map from orbit the different materials covering the surface of the Earth, natural or manmade, and how they vary with time. Visible-wavelength images are actually a pretty poor way of doing that. It's hard to tell ice from clouds; it's hard to tell urban landscapes from bare soil or rock; it's hard to tell natural vegetation cover from agricultural land.
Using those near-infrared bands, on the other hand, gives you lots more information, particularly about the vegetation. The 830-nanometer band -- Band 4 -- is right at that spot where chlorophyll is brilliantly reflective. So in a 5/4/3 image, healthy vegetation is brilliant green. Exposed soils are mauve. Old icy snow is blue. This particular choice of images is super for surveying vegetation cover and land use. Here's what happens when you crank up the color contrast to help tell different kinds of land cover apart. In the farmland outside the national park, you can see a range of colors from dark green (trees) to brilliant green (vegetated farmland) through pink to mauve (bare soil).
Here's a nice description of how different band combinations help you map different things. I won't drop squiggly lines on you today but if you'd like to see spectra showing how different materials look in the different Landsat bands, you can check here.
The thing is, I'm a geologist and I don't usually care about land use. When I'm looking at Landsat images, I'm after one of two things. I either want a photo that shows me what it would look like if I were looking at it with my own eyes from space, or I want one that emphasizes and discriminates differences in rock or soil type, not in vegetation or land use. So these "Natural Color" images -- which are unfortunately all that seemed to be available for three of my four choices -- are not what I want. For geology, I'd definitely want Band 7 (which is just beyond 2 microns) and then a near-infrared and a visible band. That's usually what I'm after. But for a place that is as heavily vegetated as Mount Taranaki, there's not much point in trying to discriminate rock types.
Today I want a real "Natural Color" image. To do that, I need Bands 3, 2, and 1. Unfortunately, for three of the four images I picked out, those bands weren't available. It's only for the one where there was a "Level 1 Product" available that I could download all 7 bands separately as TIFF files. I took bands 3, 2, and 1 and combined them in exactly the same way I would combine the red, green, and blue filter images taken by a rover or Cassini to make a color photo. Then I tweaked the color a little, adjusting the brightness and contrast of each band separately, to make the snow look white and the ocean look dark and the forest and farmland greens in between.
As usual, this is a much longer post than I had originally planned on writing. I encourage you all to go explore Earth using LandsatLook for yourselves. Just browsing the data is super easy, and it's really quite fun to scroll backward in time and look for changes in the landscape or even just funny cloud shapes. For most purposes, you don't need to jump through all those hoops to actually get the data -- you can just export the display to an image file. If you explore and find any particularly nice examples of Earth geology for which there is Level 1 data available, let me know!
Support our core enterprises
Your support powers our mission to explore worlds, find life, and defend Earth. You make all the difference when you make a gift. Give today!
Donate

 Explore Worlds
 Find Life
 Defend Earth


