Emily Lakdawalla • Feb 07, 2013
Pretty picture: tessera terrain on Venus
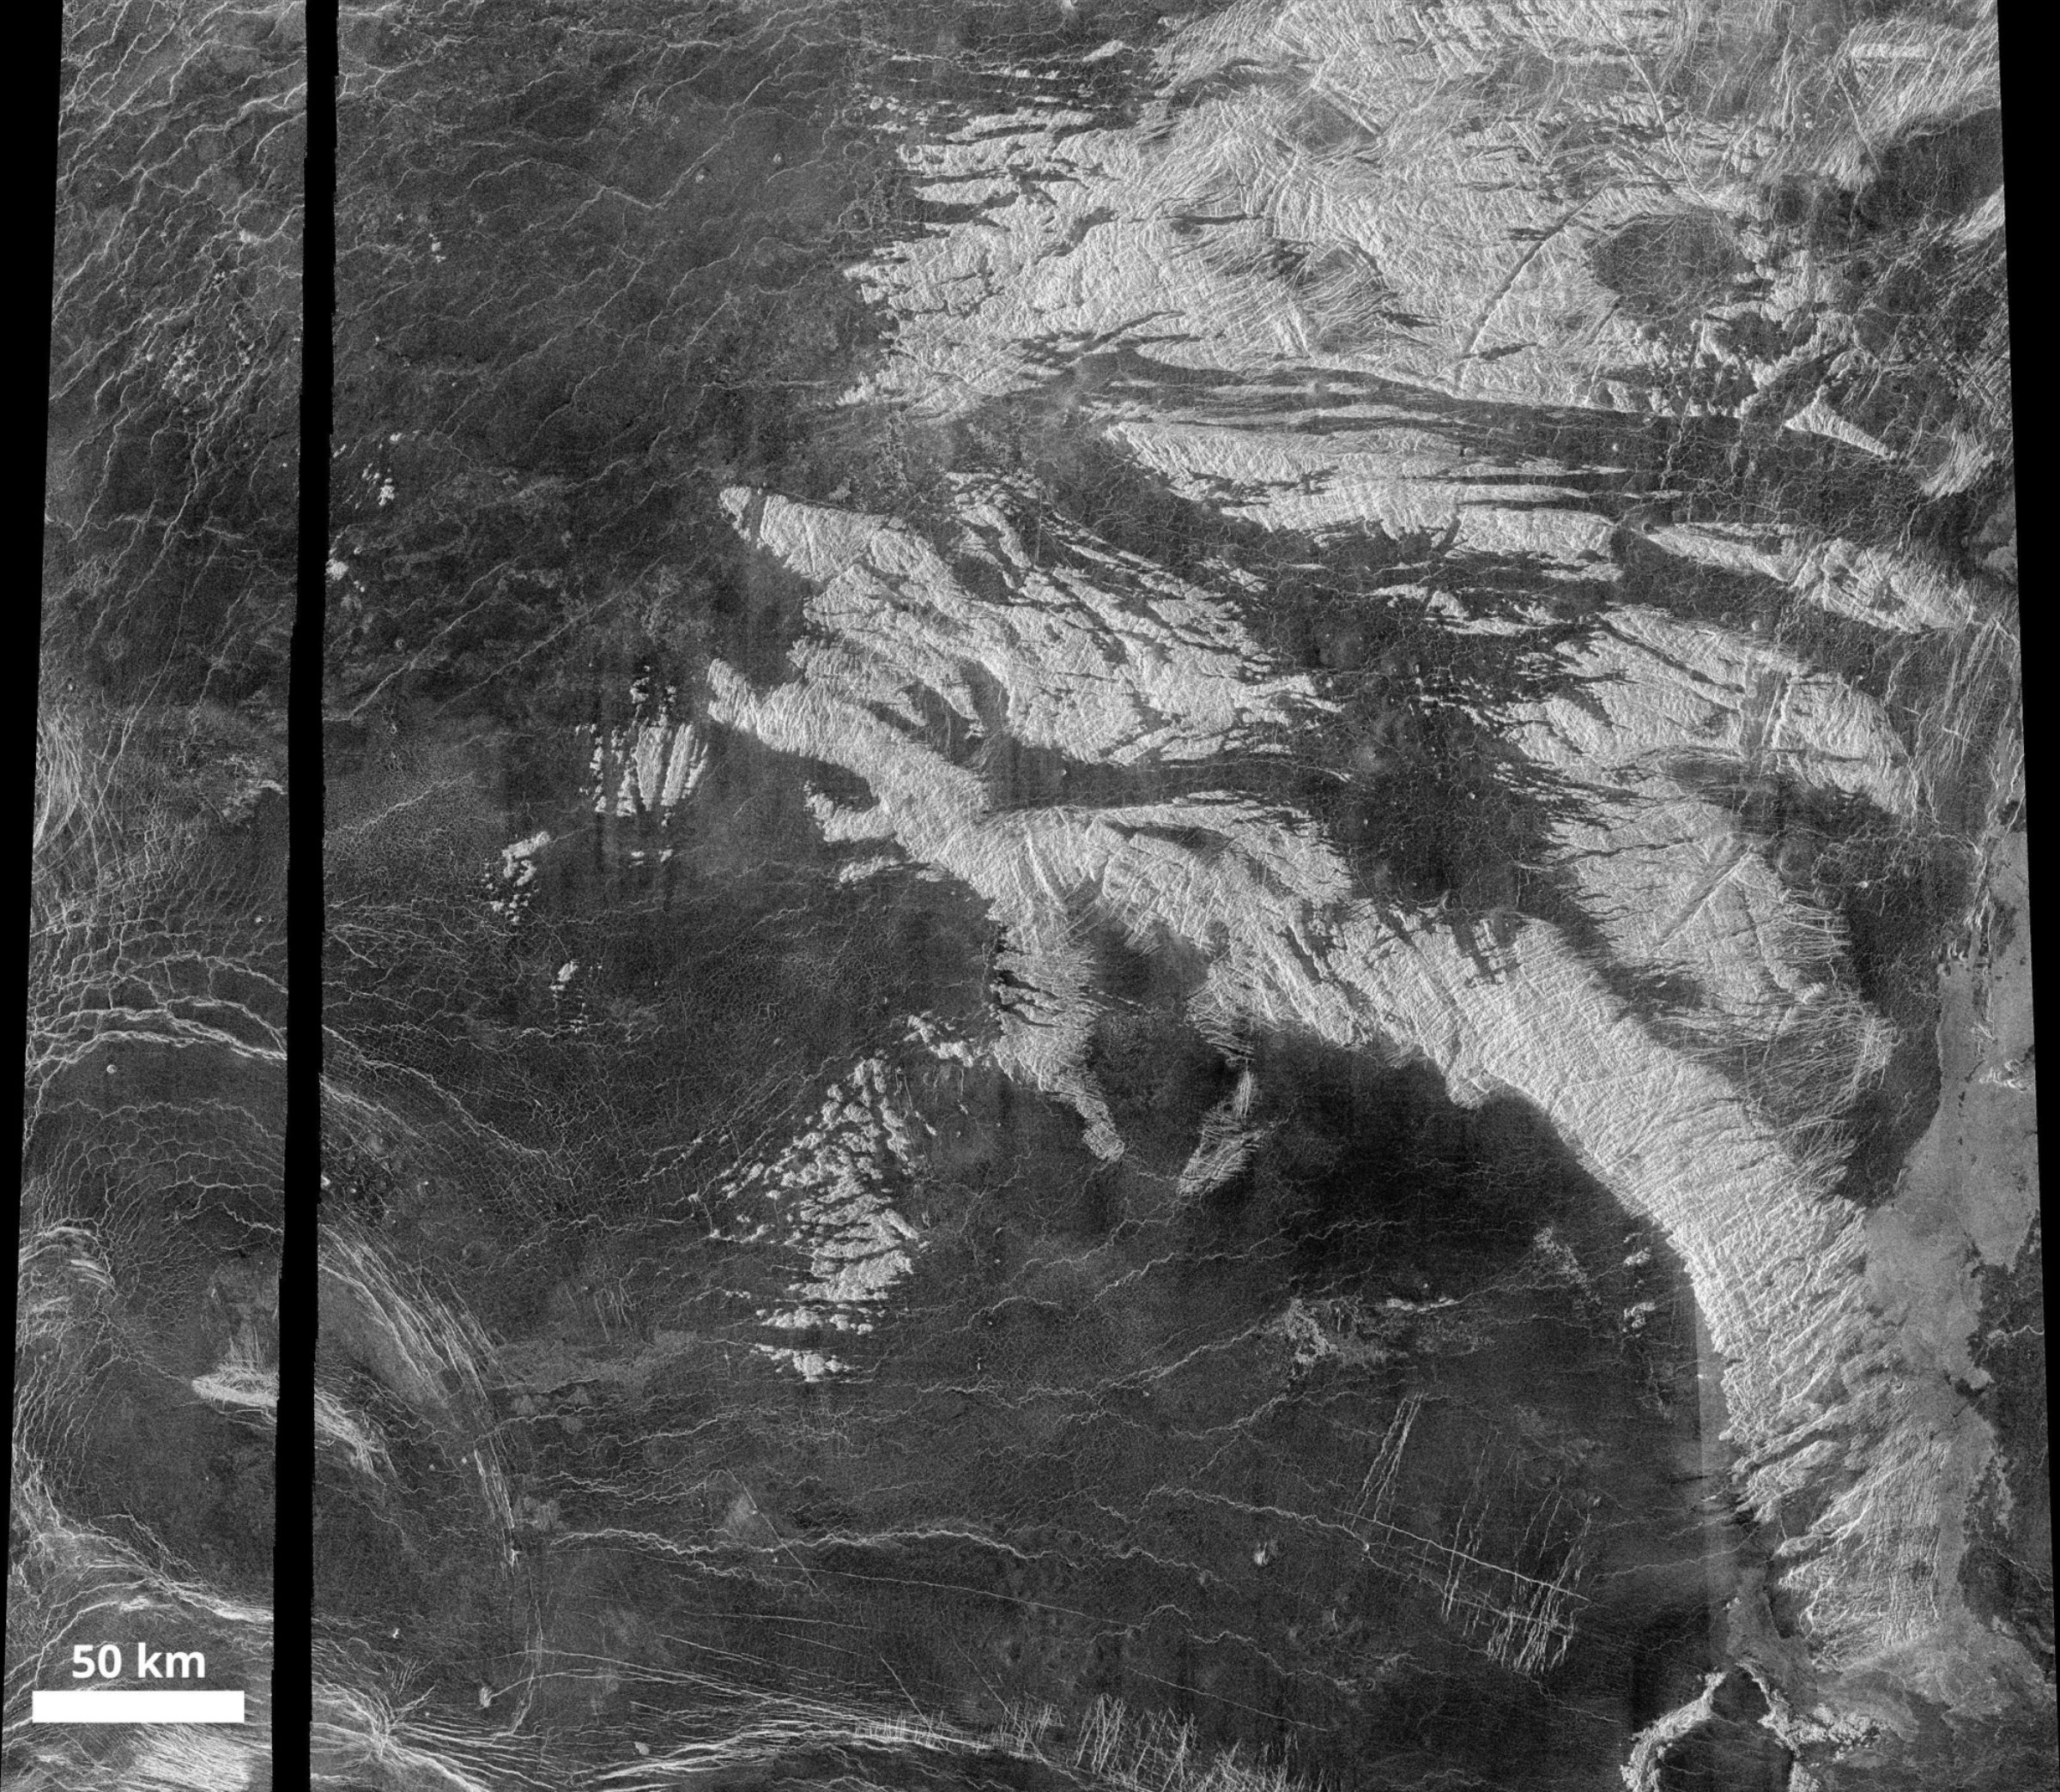
Venus is underrepresented in planetary geology these days, because there hasn't been a new mission that could clearly see the surface since Magellan ended in 1994. Which is sad, because Venus' surface is so striking. I've been working on filling out the "space images" section of our website lately and decided we need more Venus. So here's a picture of the surface of Venus, which I found while browsing around the planet at mapaplanet.org. Here's a direct link to the map-a-planet page for this part of Venus. I picked this spot to show you a particular kind of rough terrain on Venus' surface known as "tessera."

If you zoom in and take a look around, you can see how tessera is broken up by fractures and/or folds -- multiple generations of them, criscrossing each other willy-nilly. At its edges, you can see how the darker (hence, smoother) plains lavas lapped up onto the tessera, making it look in some places almost like the lavas dissolved the tessera away.
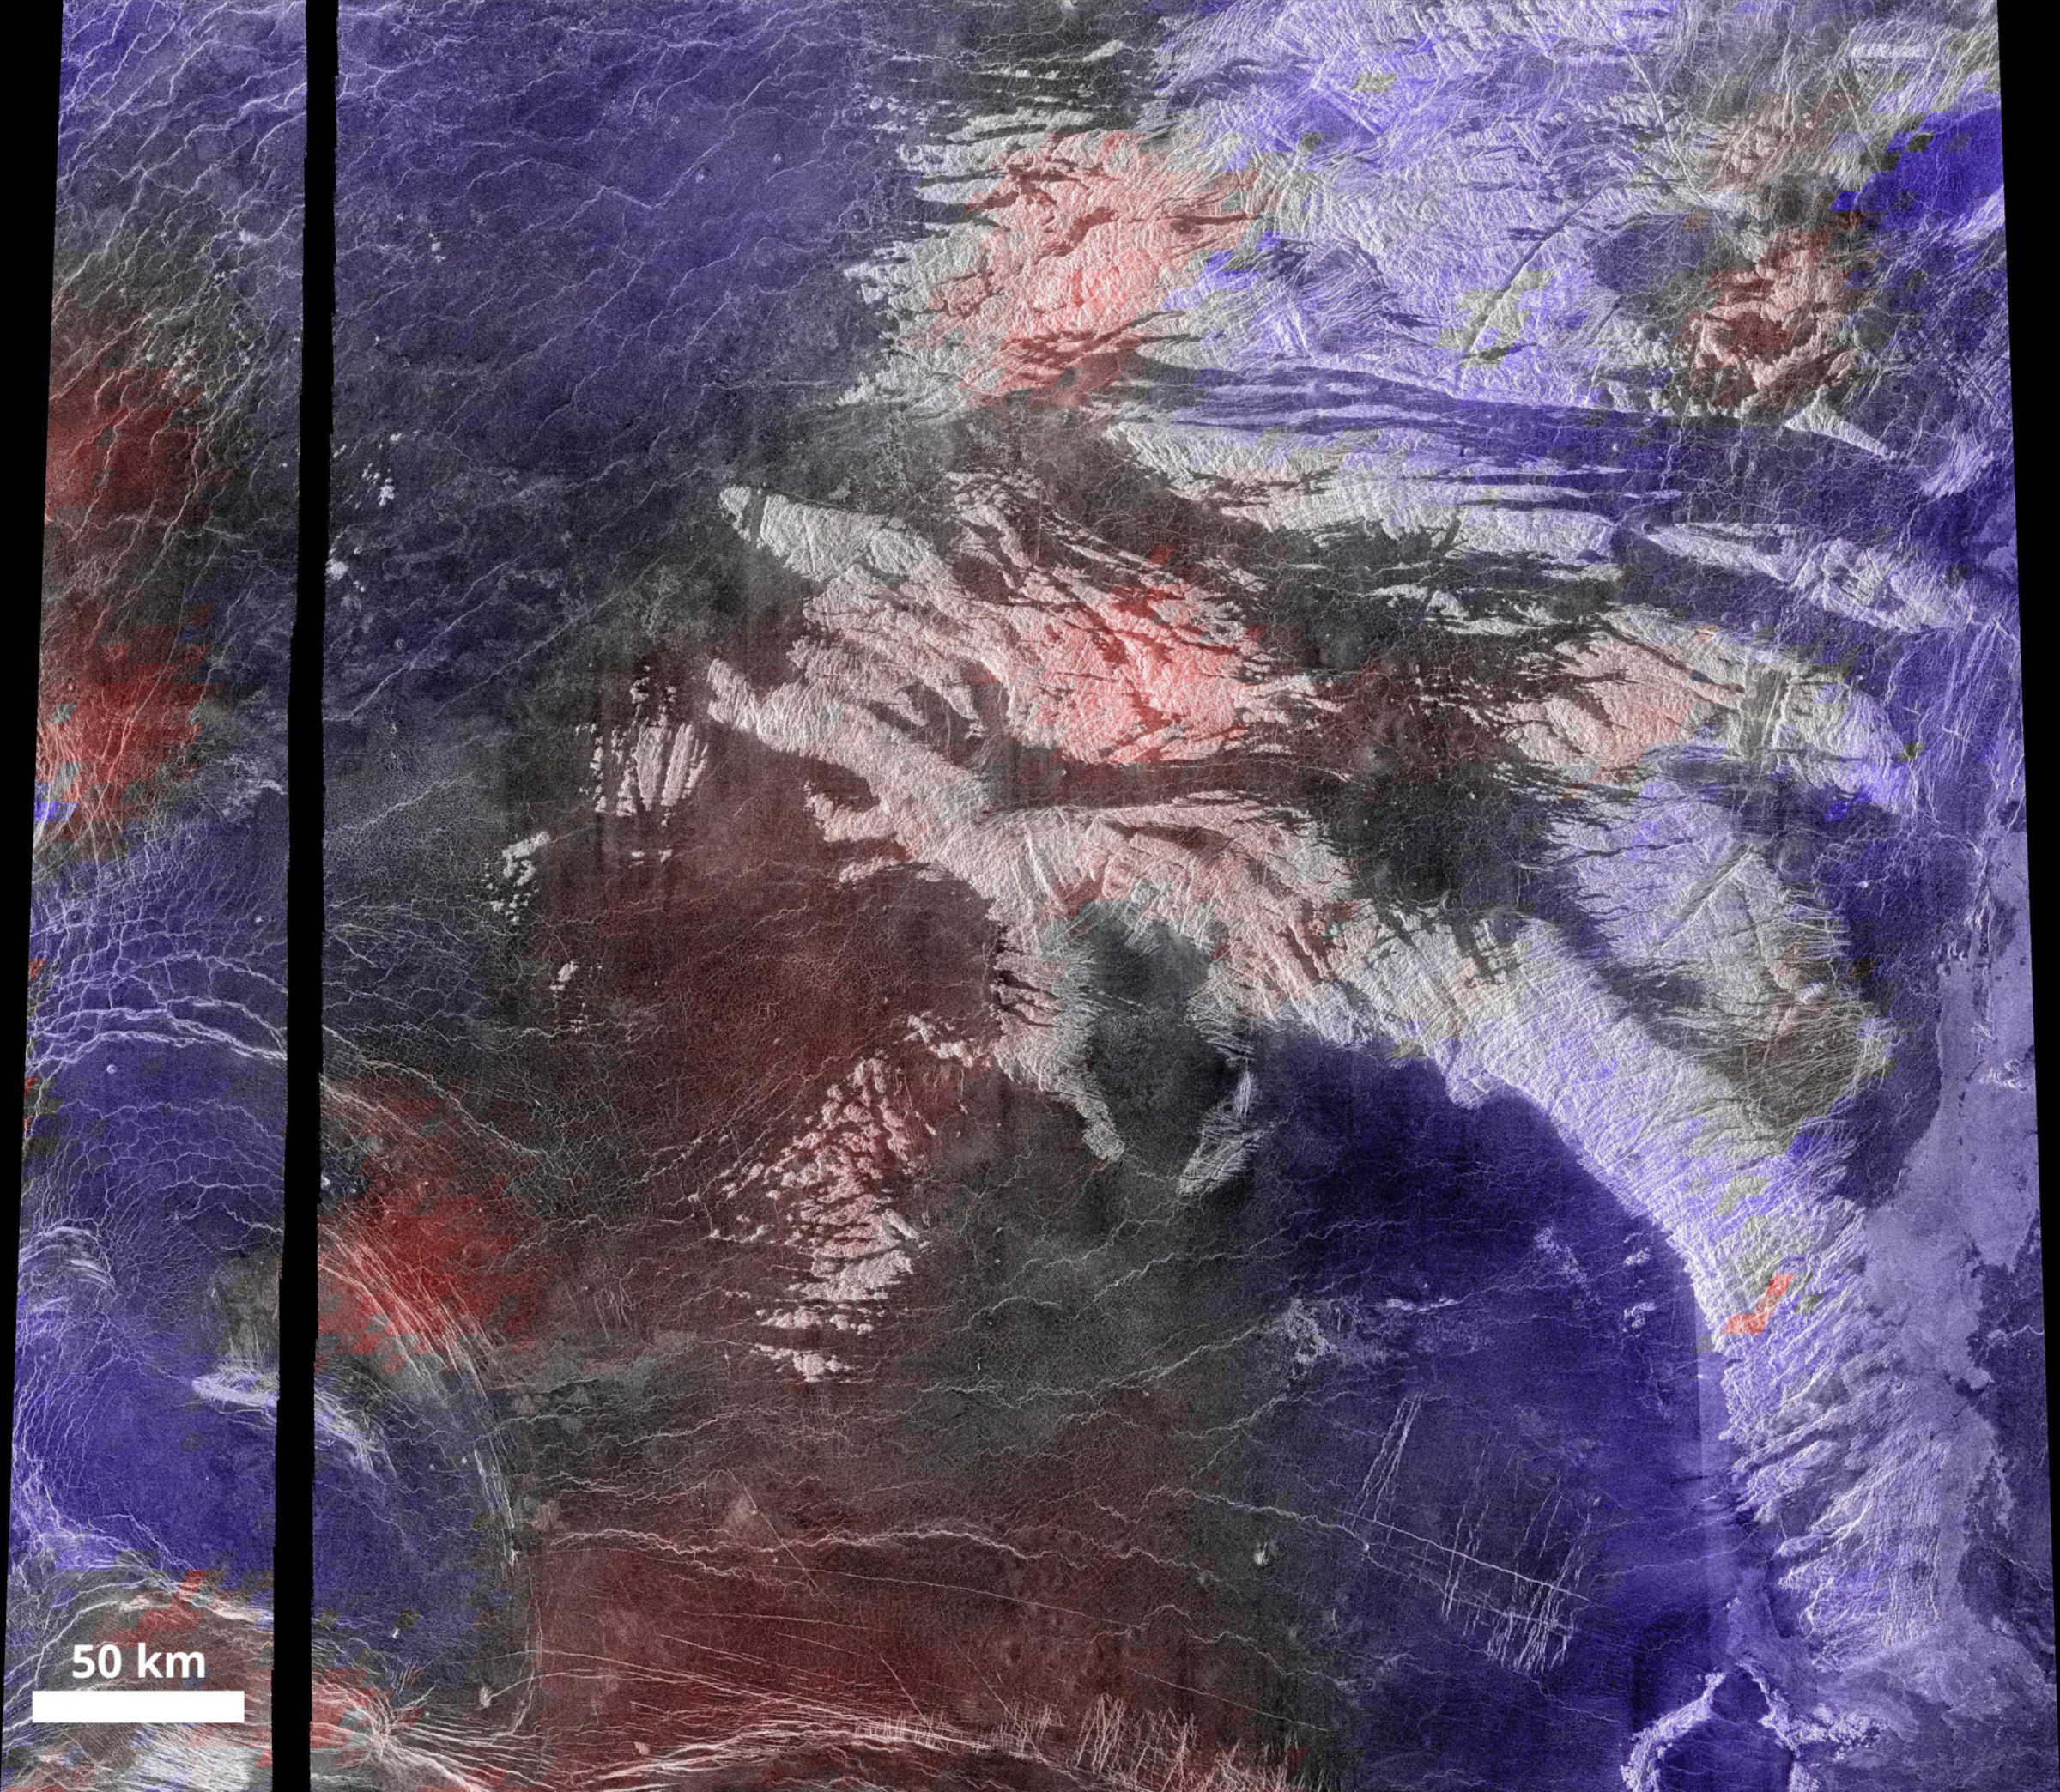
You might predict that the remaining tessera stand high, and the lava plains low. When you look at the data, though, the actual story of the topography isn't that simple. Magellan did return topographic data, but its resolution is nowhere near the resolution of the radar images. Here's what the topographic data look like for exactly the same region. Dark is low, bright is high. Each of those little parallelograms is a pixel in the global digital elevation model for Venus. And each of those pixels is actually substantially smaller than the footprint of Magellan's altimeter. It actually sampled an area about 2 by 3 or 4 pixels in size each time it bounced a radar signal off the surface to measure the range.
It wasn't at all obvious to me how this elevation data related to the image data, so I did an old trick: I colorized the elevation data and overlaid the color on the image. Incidentally, it's common to use a rainbow spectrum for this operation, but that is very bad for people who are colorblind. I adopted a color table suggested in this Eos article, where blue is low, white is intermediate, and red is high elevation. Voila. Have we learned anything?

Here is what I learn from looking at the photo:
- We've disproven the hypothesis that the tessera terrain in this image is high-standing with respect to the dark plains. There are some tessera spots that have some of the highest elevations, but others have some of the lowest elevations; the same is true of the plains.
- The only correlation between terrain type and elevation that I can see has to do with the little shield volcanoes that you can see pimpling the landscape in little clusters here and there. There's one such shield field near the bottom center, which is high in elevation. Look around at other high-elevation spots and you'll see that many of them contain clusters of shields. But not all of them.
- The other thing that I notice -- and this is much easier to see by looking back to the middle image I posted, just the topography data -- is that there's much more variance in the topography within the tessera areas than within the predominantly-plains areas. There's a band of kind of muted-looking topography crossing the image from upper left to lower middle, and that's the same place where you see a wide swath of plains lava. Look in the tessera areas, on the other hand, and you see very high spots right next to very low spots. I've noticed that elsewhere on Venus, too. I don't really know what it means, but it's made me a little distrustful of the topography data in these rough terrains.
There is a new topographic data set for parts of Venus, developed by Robbie Herrick, based on stereo imaging rather than on the altimetric data. I downloaded some of the data but it's just a little beyond my image processing comfort zone and I didn't wind up producing anything I was willing to show anybody. If any of you out there try it with better results, let me know!


 Explore Worlds
 Find Life
 Defend Earth


