Jason Perry • Oct 18, 2018
Looking at Io's Volcanoes Since Galileo
It’s hard to believe that it has been almost 15 years since NASA's Galileo spacecraft crashed into Jupiter, and even longer — 17 years — since the spacecraft took meaningful data of Jupiter’s volcanic moon, Io. It will be another 8 to 12 years before NASA’s Europa Clipper and ESA’s JUICE can regularly monitor Io’s volcanoes. Fear not, Io fans. Since Galileo's demise, scientists have studied Io’s ever-changing surface by every means possible.
We can see Io from Earth-based telescopes. New Horizons studied Io when it flew by the Jupiter system, in early 2007, on its way to its historic flyby with Pluto. More recently, the Juno spacecraft at Jupiter has acquired near-infrared images of Io’s polar regions.
Juno’s eye on Io
Most of the new pictures you’ve seen of Jupiter here and elsewhere have been from JunoCam. But JunoCam’s wide field of view limits the resolution of its images of Io, making only the broadest-scale surface visible. Fortunately, as Björn Jónsson noted in a blog post here back in April, Juno also has the Jovian Infrared Auroral Mapper or JIRAM instrument, a near-infrared imager and spectrometer built and managed by Institute for Space Astrophysics and Planetology and funded by the Italian Space Agency. The instrument’s imaging mode, which can acquire images at both L- and M-bands (3.4 microns and 4.8 microns, respectively), has high enough spatial resolution to allow researchers to monitor volcanism on Io.
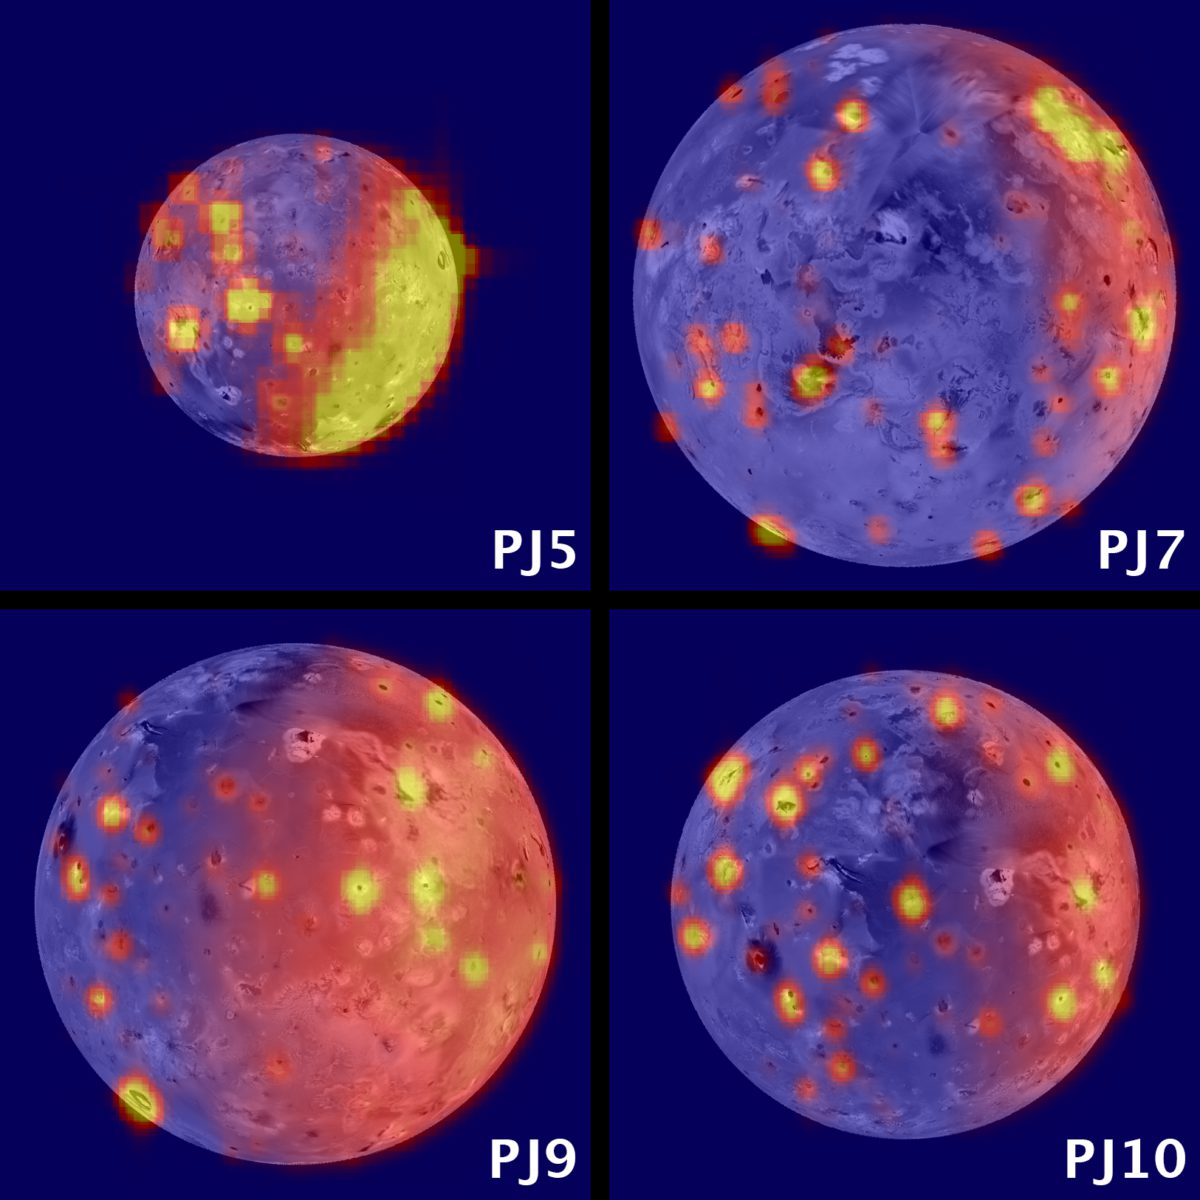
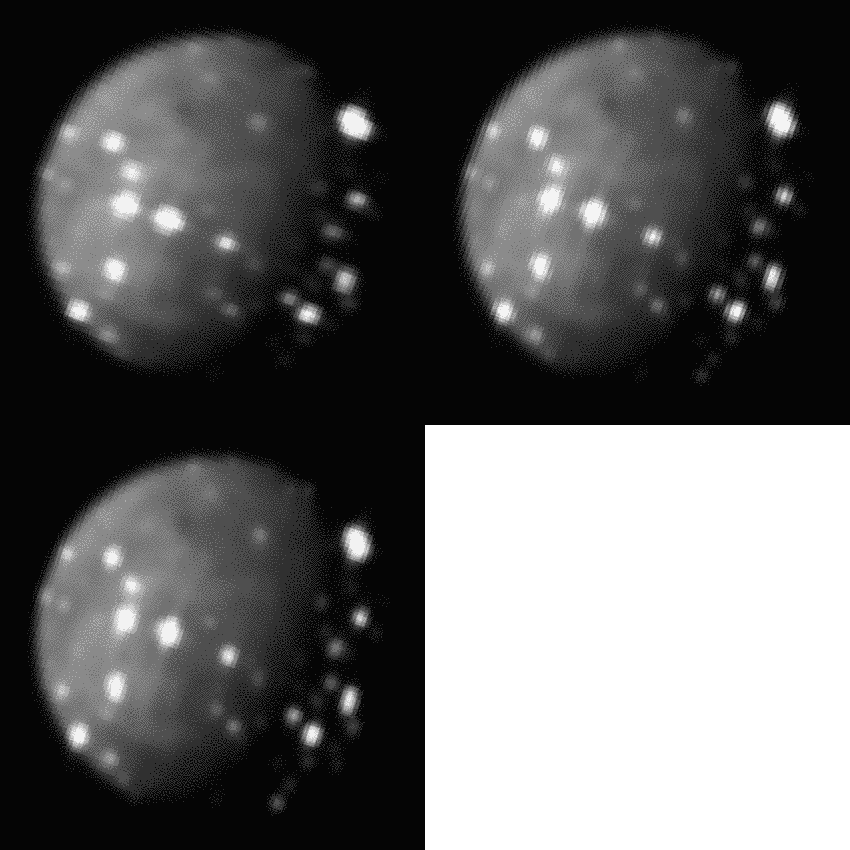
Over the last few weeks, I’ve examined JIRAM data of Io acquired during four perijove (PJ) passes in 2017: PJ5 (March 27, 2017), PJ7 (July 11, 2017), PJ9 (October 24, 2017), and PJ10 (December 16, 2017). Due to Juno’s high-inclination orbit around Jupiter, JIRAM is able to image Io’s polar regions. No other spacecraft has ever gotten these polar perspectives, and we can’t see the poles from Earth, either. Juno imaged Io’s south polar region on PJ5, PJ9, and PJ10, and the north polar region on PJ7. Juno acquired the images at distances ranging from 644,000 kilometers during PJ5 to 420,000 kilometers during PJ7. The spatial resolution of this data is about an order of magnitude worse than the LORRI images acquired by New Horizons in 2007, but it’s still good enough to see heat coming off Io’s active volcanoes and do some science.
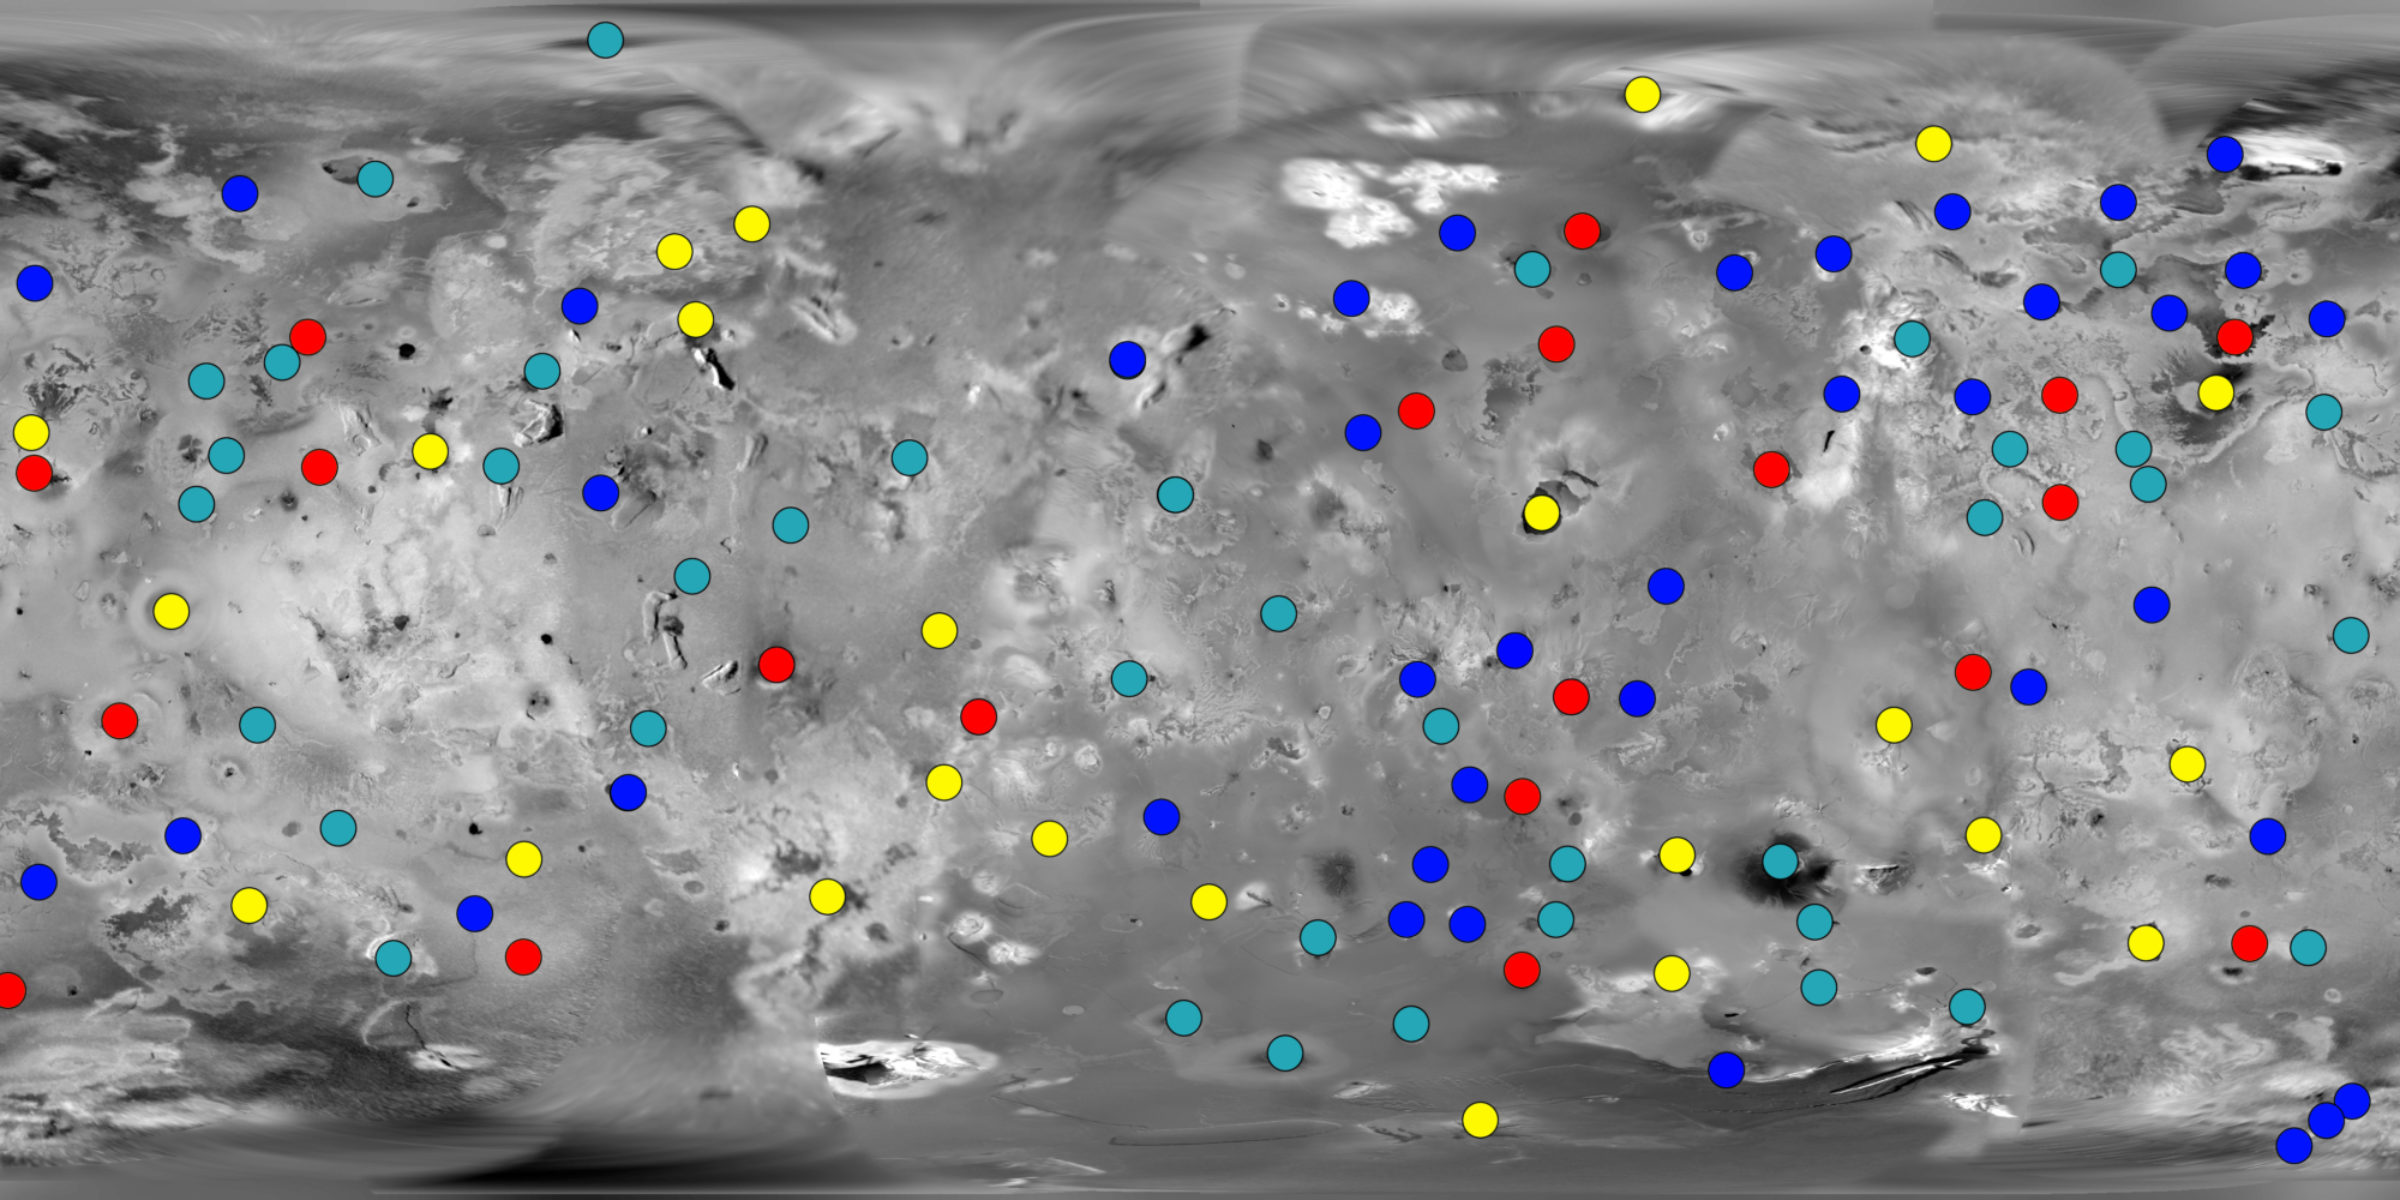
To process this data, I converted each image using Björn Jónsson’s IMG2PNG utility, since nothing else I use to view PDS images seems to work for JIRAM data. This, along with JIRAM primarily taking images using only its M-band filter, makes it difficult for me to say much about temperature or absolutely intensity beyond assigning each hot spot a simple, 1 through 4 relative intensity value. JIRAM took images of Io every 30 seconds as the moon passed through the instrument’s field of view. The repeat imaging allowed me to stack several images in each observation to produce a product with improved spatial resolution compared to a single image, making it easier to find fainter hot spots. Finally, I aligned a projected version of the USGS global map of Io to match the JIRAM summed image to help with identifying each hot spot.
Combining the JIRAM data from each pass, I identified 124 distinct hot spots, though 12 of these covered three large lava flows: Chalybes Regio, Illyrikon Regio, and Lei-Kung Fluctus. How does this count compare to past work mapping hot spots on Io? Luckily, a recently published paper has collected almost all the results from Earth-based and New Horizons observations of Io. The paper, by Clayton Cantrall, Katherine de Kleer, Imke de Pater, David Williams, Ashley Davies, and David Nelson, helps us to understand recent Juno observations of Io’s volcanoes.
Earth-based observations since Galileo
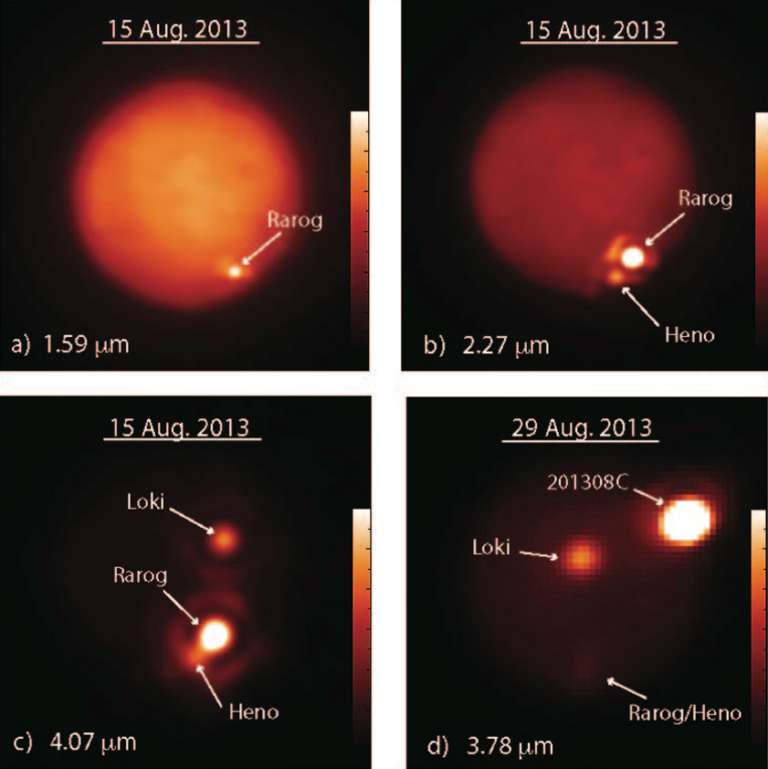
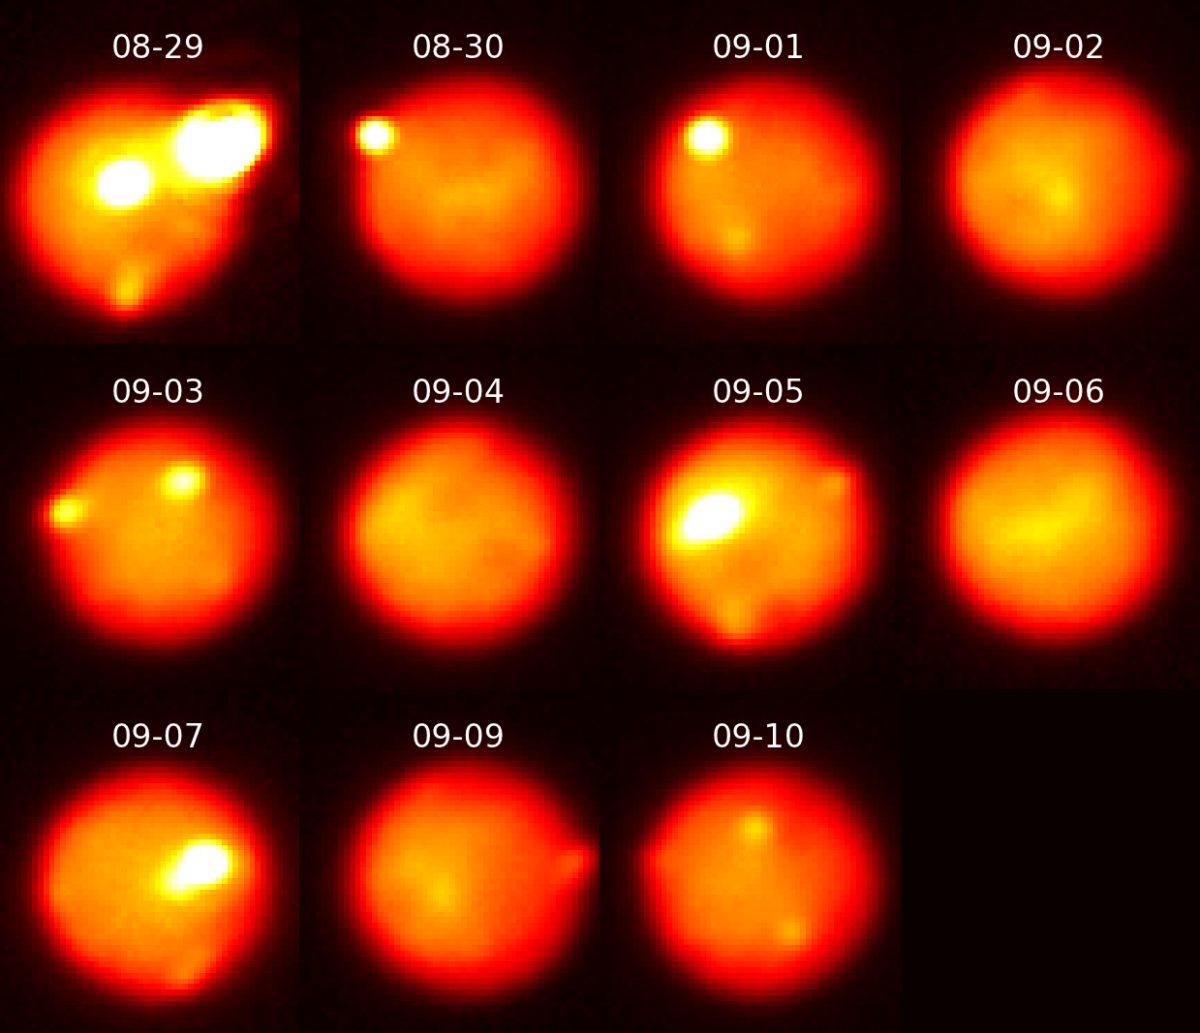
Since 2001, Imke de Pater and other researchers, including Franck Marchis, Conor Laver, Katherine de Kleer, and Clayton Cantrall, have used adaptive optics images acquired at the Keck II and Gemini North telescopes atop Mauna Kea in Hawaii to monitor volcanic activity on Io. While the images don’t have the detail we can see from spacecraft flying past Jupiter, they do have sufficient resolution to distinguish different volcanoes across Io’s surface. The telescopes can also measure the intensity of each volcano’s glow at different wavelengths. Armed with these measurements, the astronomers estimated the heat put out from individual volcanic centers, and can watch how it changes year over year.
Clayton Cantrall and his co-authors, in a paper published in the 15 September 2018 issue of the journal Icarus, consolidates the de Pater group data with two other data sets: some unpublished data acquired between 2003 and 2009, and observations taken as New Horizons flew by Jupiter in 2007. The combined data set included 156 separate nights of Earth-based observations, spanning 15 years and covering all longitudes of Io.
Cantrall et al. identified 88 distinct hot spots, of which 24 had not been detected previously by Galileo (though one of the 24 had been detected as a hot spot by Voyager). Of the 88 hot spots, 82 were detected more than once. The astronomers classified 18 as "persistent," meaning they were seen in more than half of all the observations in which they might have been visible. Many of these, like Pele, Marduk, Isum, and Janus, were considered persistent during the Galileo mission. A few are new since Galileo, like Uta Patera and another near Chalybes Regio in Io’s north polar region. Apparently Io's volcanoes can be dormant for a long time, but also become active for a period spanning decades.
The authors also identified five outbursts, eruptions so powerful that Io’s brightness as seen at an infrared wavelength of 5 microns more than doubled, but which only lasted a few days at that level. They detected 15 “mini-outbursts” from 11 different volcanoes. It was one of these outbursts, at Tvashtar, that New Horizons observed during its encounter. The massive volcanic eruption included lava fountains so powerful and bright that New Horizons saw them in sunlit imaging of Tvashtar and a 400-kilometer-tall dust-rich plume. The outbursts are not spaced out evenly in time, with three outbursts detected in August 2013 and only two others across the rest of the 15-year timespan.
With 15 years of data to work with, the authors of this paper were able to note that despite the occasional outburst or new eruptions coming and going, Io’s total heat output remained steady, which is important for understanding how evolution of Io’s orbit and the subtle changes in tidal heating in its interior might affect heat output. They were also able to chart how activity at individual hot spots varies with time, leading to a rather intriguing finding.
In a few cases, activity at nearby volcanoes tended to mirror each other. For example, heat output from Janus Patera decreased after a mini-outburst at the nearby Kanehekili lava field in 2010, before returning to normal in 2013. They suggest that these similarities in thermal emission across hundreds of kilometers might arise from very large regional magma sources (instead of each volcano being powered by a distinct hot spot), and that these regional magma sources can be depleted by outburst-scale eruptions.

Adding the JIRAM perspective
Returning to my analysis of the JIRAM data: of the 124 hot spots I saw, 105 were in places where previous researchers had noticed hot spots, either from ground-based data or from spacecraft like Galileo. JIRAM also detected all of the hot spots identified by Cantrall et al. as persistent, though 1 of them (the hot spot at 47 South, 109 West) showed up, very faintly, in only 1 of 3 passes where it might have been visible. JIRAM also observed activity at 4 of the 5 outbursts identified, though at much lower intensities. Eight of the 11 mini-outburst sites remained active, with Kurdalagon Patera the most intensely active.
While Earth-based observations help with filling the gaps between spacecraft visits to Jupiter, Juno’s high-inclination orbit does provide a perspective that is just not possible from Earth. For example, the high-inclination orbit provides a unique look at hot spots within Io’s polar regions and the ability to observe Io’s nightside helps with detection of fainter hot spots that might otherwise be difficult to distinguish from reflected sunlight. Cantrall et al. identified only 3 hot spots poleward of 60°, while JIRAM detected 15 (of which 3 can be attributed to a single lava flow in Illyrikon Regio).
Combining the Cantrall et al. data set with JIRAM could be useful, particularly for looking at the distribution of hot spots across Io’s surface. Both show an interesting dip in detected hot spots close to Io’s equator and both show a peak in hot spot detections between 300° and 330° West longitude, the same longitude range as Io’s most powerful volcano, Loki Patera.
Even with only four observations, JIRAM can still be useful for looking at how Io’s volcanic activity changed over the course of 2017, particularly in the southern hemisphere. Two new major eruptions began, one at an unnamed patera at 28° South, 38° West starting between March and October 2017, and another at a lava flow near Io’s south pole at 79° South, 317° West starting between October and December 2017. Another possible new eruption appears to have begun at Arusha Patera between March and October. An eruption near Päive Patera also appears to have begun and [E2] wound down in 2017, saturating the detector with its intensity during PJ5 and decreasing in brightness with PJ9 and PJ10. The most powerful eruption (outside of Loki) detected by JIRAM was at Chalybes Regio. This volcano, likely a fresh, extensive lava flow, was identified as a persistent hot spot by Cantrall et al. but was never seen as an active volcano by Galileo.
What can we learn about what’s going on inside Io?
One of the bigger questions scientists are trying to answer about Io is: How exactly is Io’s interior being heated? We’ve known since Voyager that the resonant orbits of Jupiter’s other moons Europa and Ganymede cause large tides on Io. The tides flex Io’s interior. The energy pumped in to Io by the tides gets dissipated as heat. But we don’t know where in Io’s interior that heating is taking place: is it just below the surface in a layer called the asthenosphere, or is it deep within Io, closer to its core? Most people’s models suggest that asthenospheric heating is the likely answer, but Galileo measurements suggest that heating is evenly split between shallow and deep locations.
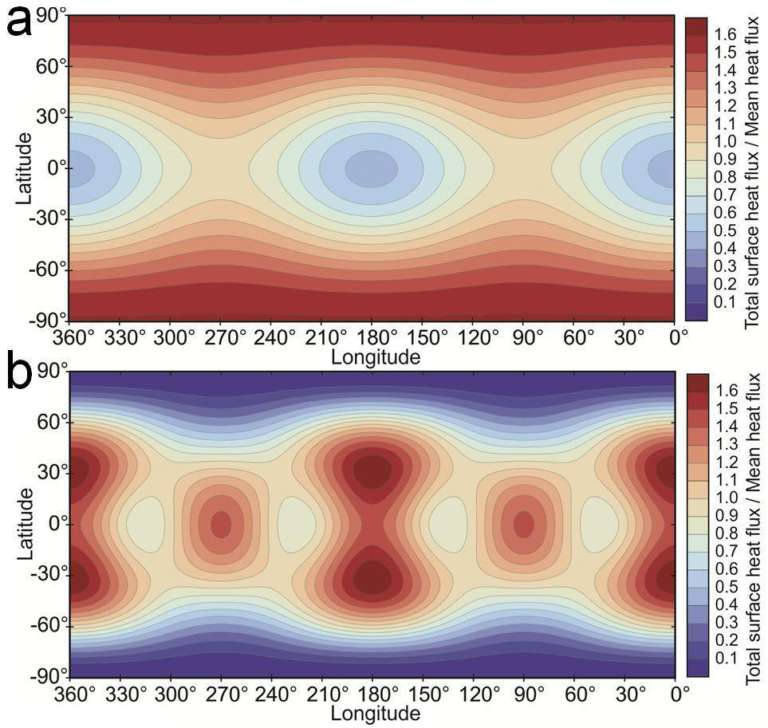
One test for understanding tidal heating within Io is look at how hot spots are distributed across Io’s surface. For asthenospheric heating, most of Io’s internal heat should be escaping from several points along Io’s equatorial region. If Io’s tidal heating is mostly being generated near its core, then that heat would be escaping primarily from its polar regions. The data Cantrall et al. have consolidated, particularly with the persistent hot spots, adds another point in favor of the asthenospheric heating model. An even better match is found if you assume that Io’s asthenosphere is partially molten, similar to the interior of the early Moon. This supports a finding by Krishan Khurana et al. in 2011 from Galileo magnetometer data that found hints of a induced magnetic field at Io generated by the interaction between Jupiter’s magnetic field and a global magma ocean.
I started my career working on Io images in the dying days of the Galileo mission, and while I have moved on to other projects since then (Cassini and now the Mars Trace Gas Orbiter), Io has always been my intellectual home. I want to thank Emily Lakdawalla for giving me a reason to look at fresh Io data, and hopefully Juno will continue taking great Io data in 2018. Even when Juno also passes into history, ground-based observers like Katherine de Kleer, Clayton Cantrall, and Imke de Pater will be crucial to help us understand the state of Io’s volcanic activity when the next great Jupiter system missions arrive in the late 2020s and early 2030s.
Support our core enterprises
Your support powers our mission to explore worlds, find life, and defend Earth. You make all the difference when you make a gift. Give today!
Donate

 Explore Worlds
 Find Life
 Defend Earth

