Jodie Utter • Apr 27, 2012
How Science Informs Art
Introduction: My father is the emeritus director of the Amon Carter Museum of American Art in Fort Worth, Texas. Since his retirement from his directorship he has been working to produce an exhibition and book of the watercolor paintings of the artist Charles M. Russell, an important American artist who chronicled the western frontier and whose artwork influenced Hollywood depictions of native Americans and cattlemen. (I'm sure many of you reading this can empathize with the fact that you can't get any real work done until you retire). The exhibition, Romance Maker: The Watercolors of Charles M. Russell is now hanging at the Amon Carter (through May 13). I went to see it on my way to LPSC a few weeks ago, and was struck by how many of the museum labels described what scientific analysis has revealed about Russell's materials and methods. And then, when I walked into one of its galleries, I saw a very familiar illustration on the wall: a graphic of the electromagnetic spectrum from X-ray to infrared. The graphic explained in detail what we can learn about artworks through the use of different wavelengths of light than the human eyes can see -- which is a very familiar theme to any of you who have read my posts about infrared and ultraviolet imaging of planetary bodies. I asked my Dad to ask if the person who'd done that analysis would be willing to write something about it for my blog, and Jodie Utter was willing, so here it is! -- Emily Lakdawalla

The instruments I have in my arsenal range from the low-tech, low-powered magnification to the more sophisticated, X-ray fluorescence. [Note: an XRF instrument is one of the big analytical tools in the body of the Curiosity rover. --ESL] You may be asking yourself “What do art conservation and planetary science have in common?” One focuses on the minute and the other on the enormous; however, they both involve characterization of each using means that hinge on exploiting the different regions of the electromagnetic spectrum.
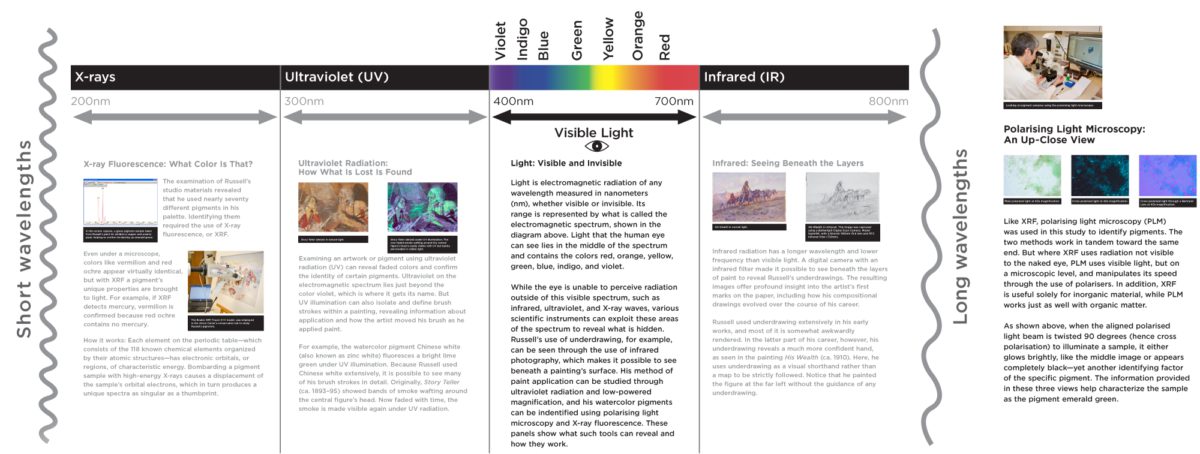
In our exhibition, Romance Maker, a wall didactic depicts an abbreviated electromagnetic spectrum with examples of the information obtained using various scientific instruments. This is designed to get the audience to think more deeply about what they are seeing in the watercolors and the science behind the art.

Russell’s underdrawings were studied using Infrared imaging. By tracking his use of underdrawing, information about his changing skill level and confidence was apparent. Russell’s pigments were characterized using x-ray fluorescence and polarising light microscopy. Many of Russell’s existing studio materials were unlabeled watercolors, marked only with a brand name. By identifying his palette, pigment and brand preferences were identified. By looking at his brands, secondary information surfaced about what and when certain artists’ materials were available on the frontier. Ultraviolet (UV) radiation was used to study his brushwork and document his use of the pigment Chinese white. Besides vermilion, Chinese white was Russell’s most-used pigment. Luckily it fluoresces brightly under UV due to its zinc component, which made it easy to identity. More detailed information from the study will be published as a chapter in an upcoming book (as yet untitled) on Charles Russell’s watercolors authored by Rick Stewart.
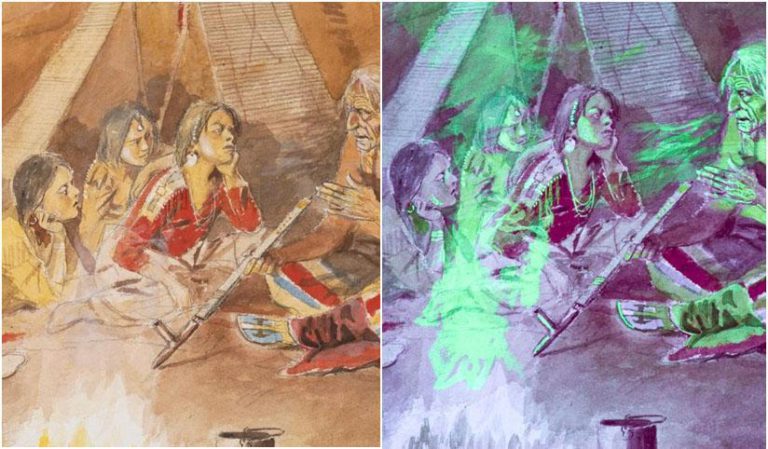
Examination with ultraviolet radiation (UV) was surprisingly useful due to Russell’s extensive use of Chinese white. Made from a form of zinc oxide, it fluoresces a bright lime green in the presence of UV. Slightly unstable, it has a tendency to fade dramatically in thin applications (see below). Although invisible to the naked eye in visible light, UV illumination isolates the faded pigment, even allowing close study of Russell’s brush stroke, the brush’s shape and size.

Support our core enterprises
Your support powers our mission to explore worlds, find life, and defend Earth. You make all the difference when you make a gift. Give today!
Donate

 Explore Worlds
 Find Life
 Defend Earth

