Emily Lakdawalla • Jan 19, 2010
Figuring out the shape of Mars (and other places)
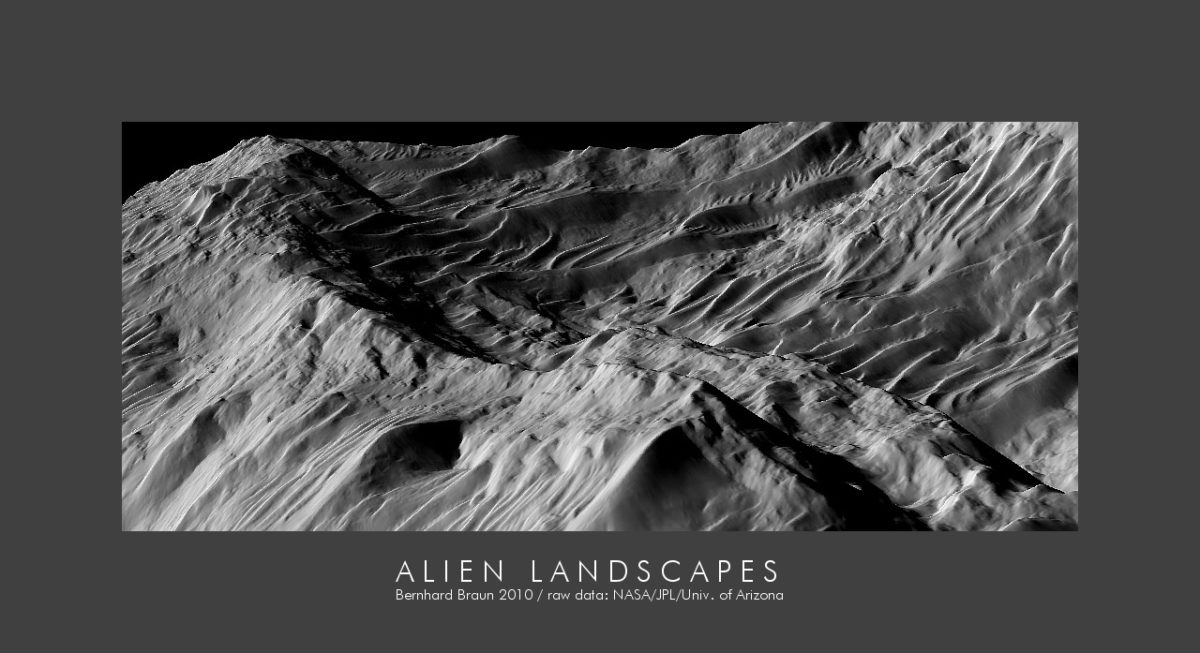
I've been following a fascinating thread over on unmannedspaceflight.com, where an amateur named Bernhard Braun ("nirgal" on unmannedspaceflight) has been posting the results from a new piece of software he's developed that generates 3-D models of landscapes from single photos. Here's just one of many stunning examples from that discussion thread:

To give some background on what he's doing, determining the shape or topography of a landscape is very important for understanding its geologic history. Here on Earth, we've traditionally gotten topography through meticulous surveys performed by surveyors with theodolites, walking from place to place to determine the location and elevation of specific points. Most recently, satellites have replaced human surveyors for the widest surveys; last year came the latest and greatest of global maps of Earth's topography from the Advanced Spaceborne Thermal Emission and Reflection Radiometer (ASTER) instrument on the Terra satellite. But you'll still see human surveyors out doing their work to develop very local-scale topographic maps before starting work on any construction project.
Few space missions have had dedicated instruments designed to measure the topography of distant worlds. Laser altimeters are relatively recent arrivals to spacecraft payloads: they have gone to space on Mars Global Surveyor, Hayabusa, Kaguya, Chang'E 1, Lunar Reconnaissance Orbiter, and MESSENGER to create global topographic maps of Mars, Itokawa, the Moon, and Mercury. Before these, Magellan mapped Venus' global topography with a radar altimeter. Cassini uses its radio instrument in an altimetric mode on Titan, but will only get scattered profiles, nothing like a global map.
What to do without measurements of a place's topography? Space scientists have gotten very tricky with processing image data to produce topographic maps. The best way to do this is to use parallax: take two images of the same area at slightly different angles, match features between them, and measure how they shift to produce a digital elevation model. This is the same way human stereo vision works. Stereoclinometry, as it's called, is computationally intensive, but recent missions have actually carried camera instruments that are specifically designed to take sets of images for stereoclinometry. The High Resolution Stereo Camera on Mars Express takes multiple sets of images as it orbits Mars, some looking ahead of Mars Express' orbit, some behind, and these different-angle images are combined on the ground to produce digital elevation models. The Mars Exploration Rovers actually perform autonomous generation of 3D models of their landscapes as seen through their engineering cameras as they drive, to help them determine where there are hazards in their environments. Even if you only have one camera, you can merge two views taken from different angles to produce topographic maps; that's how Paul Schenk created his 3D views of the Galilean moons.
But, a lot of the time, you don't have two images of the same area; you only have one. What to do in this situation? You use photoclinometry, also known as shape-from-shading. Imagine a crumpled piece of paper lit by a spotlight. Facets of the crumpled paper that are perpendicular to the spotlight will appear brightest; facets tilted away from the spotlight will appear dark. If you assume that everything in the picture reflects light in the same way, then you can tell by its albedo, or brightness, whether it is tilted toward or away from the light source.
Obviously this doesn't work so well if there's a lot of color variation across a surface. But the assumption of constant reflectance properties actually doesn't work too badly for most space surfaces. On Mars, this is one situation in which the globally distributed dust helps scientists, disguising the colors of the landscape, helping to emphasize topographic variations.
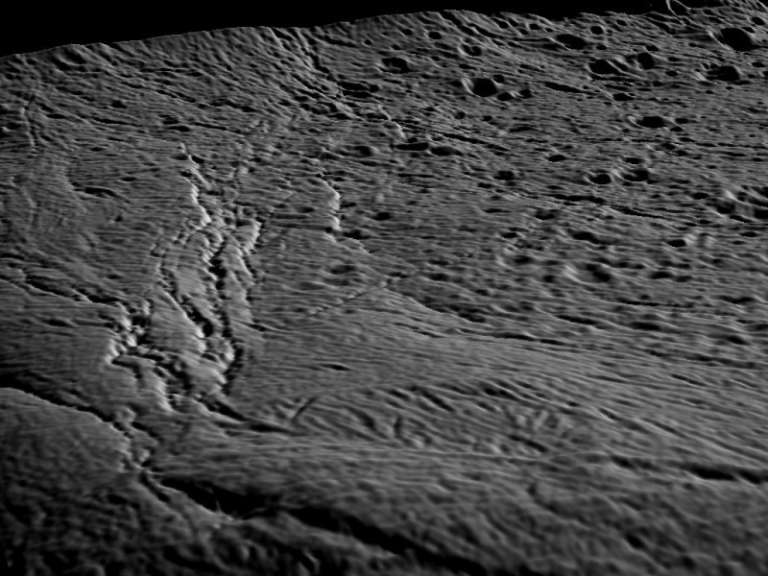
Here's another of Braun's images, this one of a bit of Enceladus.

Here's the image he made it from. The 3D view is looking along the complex of fissures on the left-hand side of the original image. I checked the latest map of Enceladus from the USGS and it's not clear to me if that set of fractures has a name yet. One fracture arcing off to the left of the image is Khorasan Fossa, but I can't tell if that set is part of Khorasan or not. The craters at the right of the image have wonderful names like Behram, Shakashik, and Zumurrud.
In the discussion in that thread, it seems that Braun's software is doing an unusually good job of capturing fine-scale variations in local topography within the images, but has more trouble with topography on longer scales. Combining his work with the more regionally accurate 3D models made from stereoclinometry could make these 3D views even better.
Support our core enterprises
Your support powers our mission to explore worlds, find life, and defend Earth. You make all the difference when you make a gift. Give today!
Donate

 Explore Worlds
 Find Life
 Defend Earth


