Casey Dreier • Dec 09, 2013
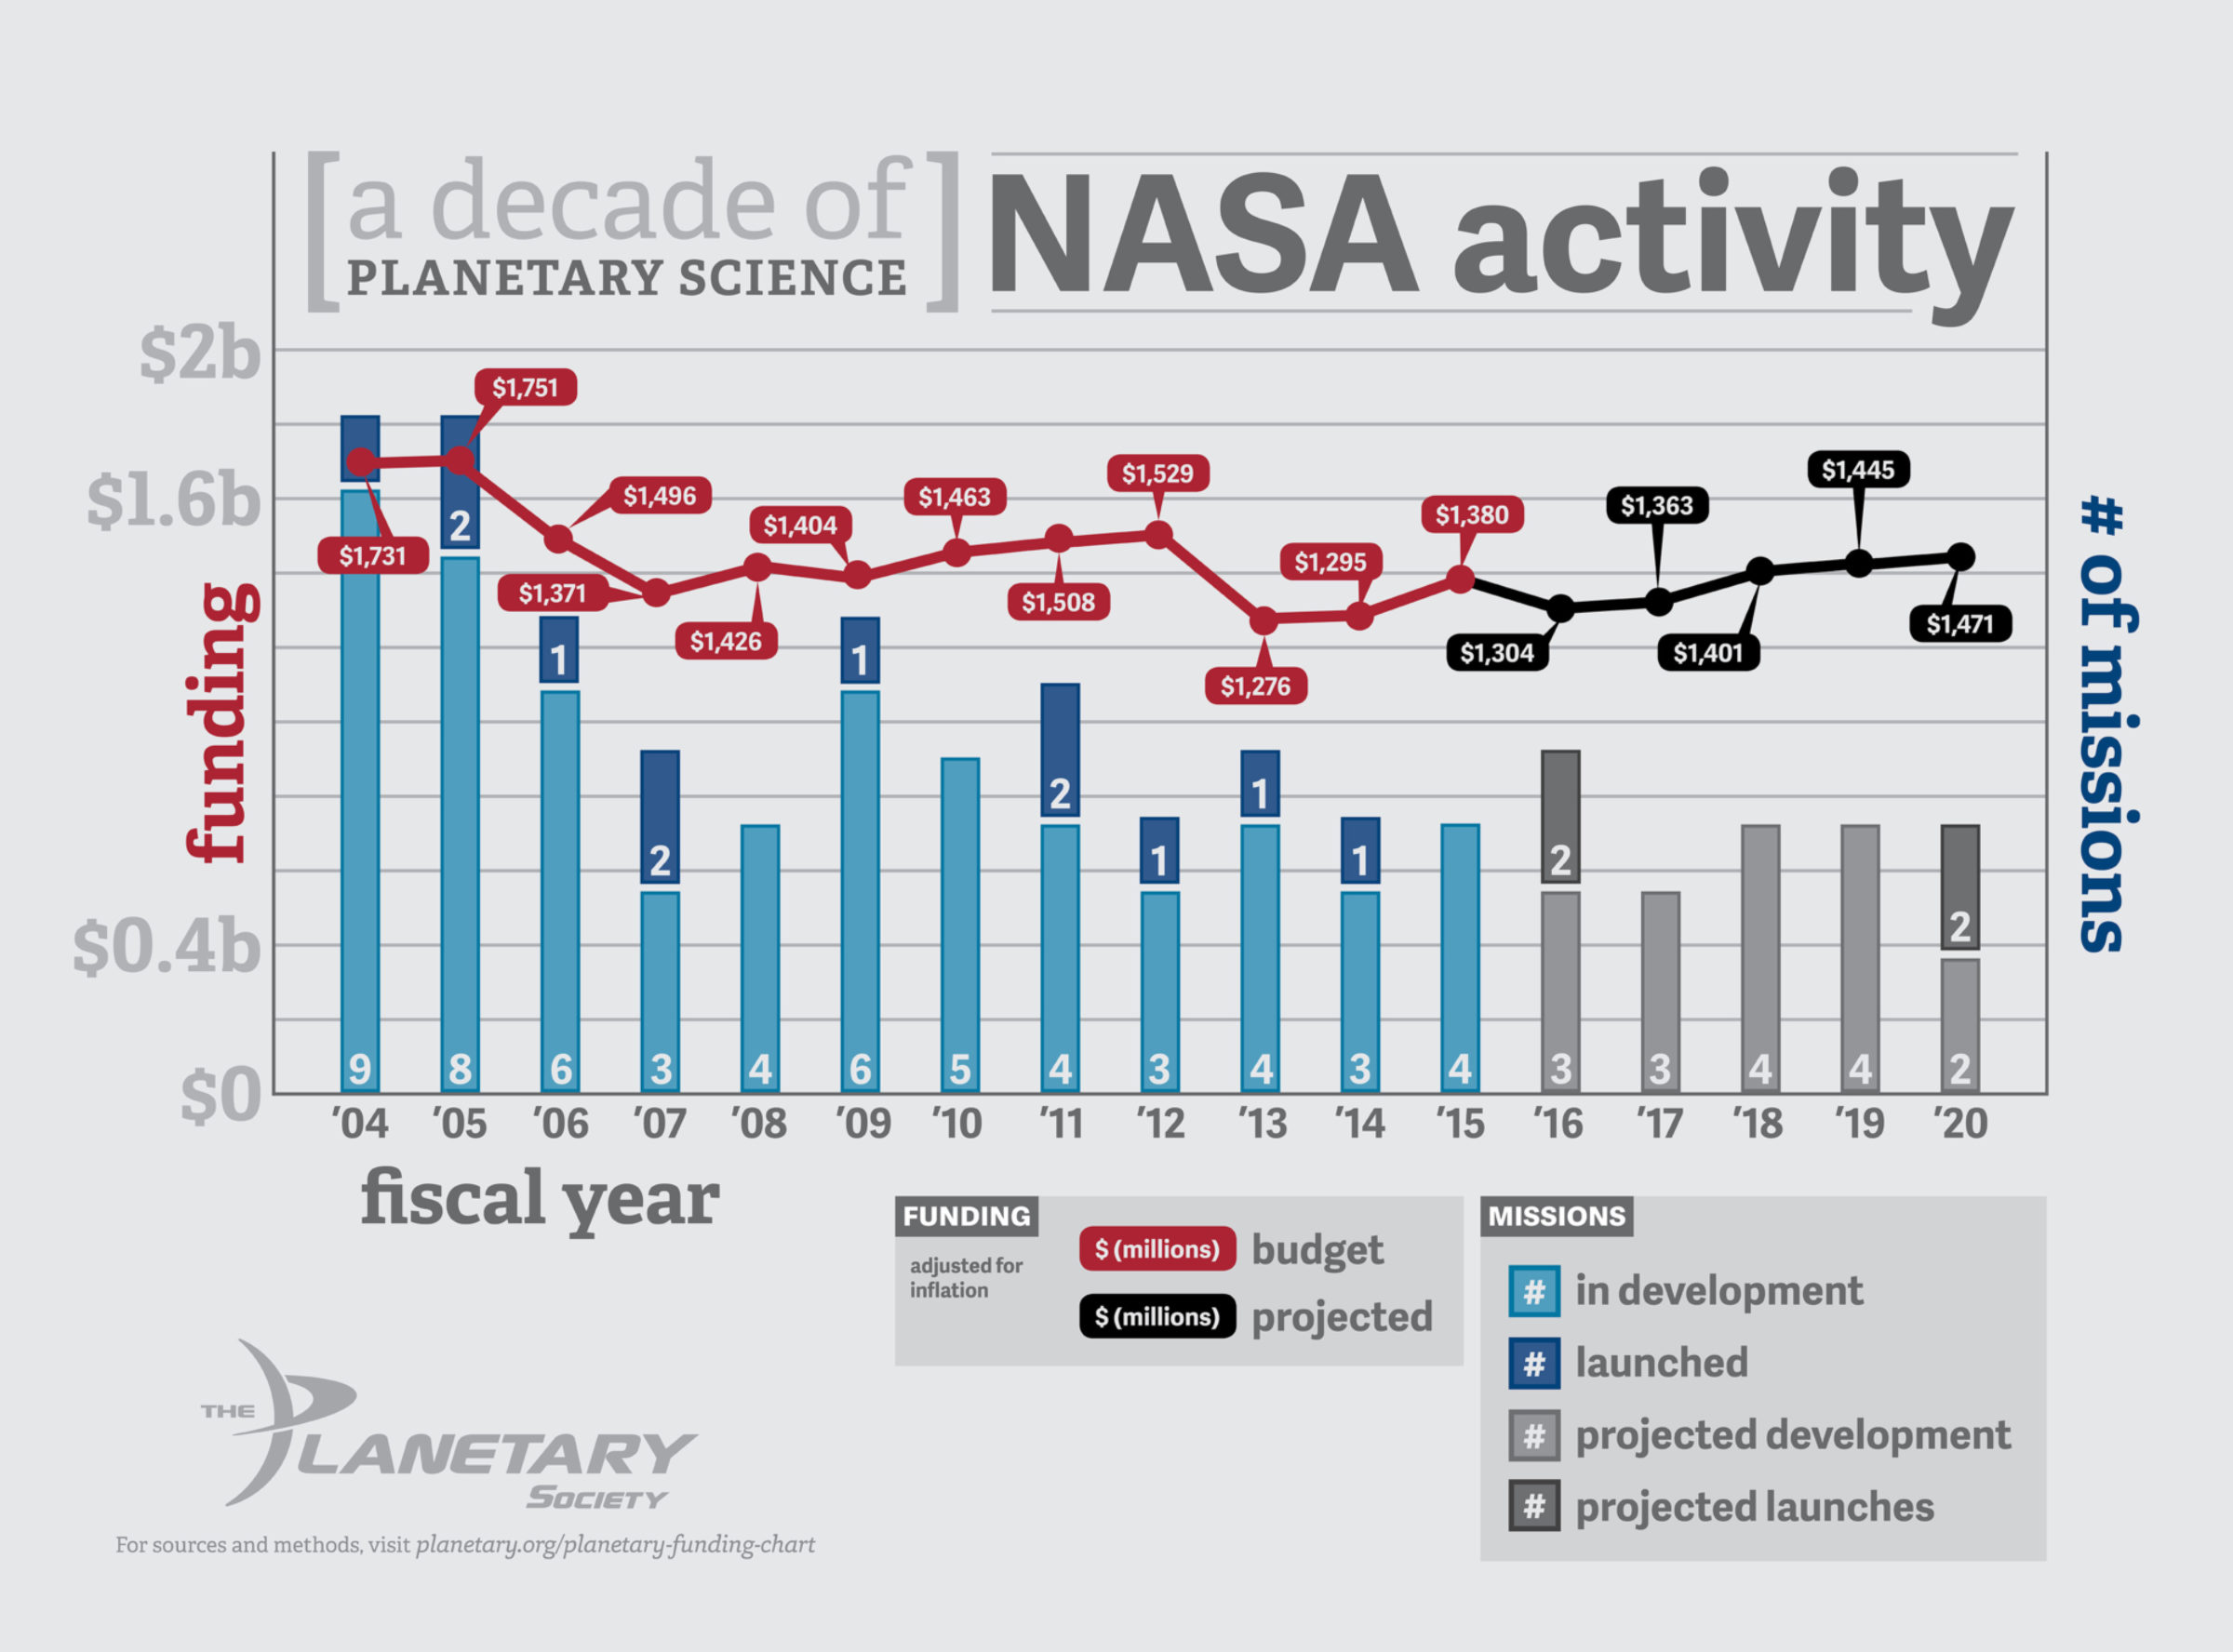
The Sorry State of Planetary Science Funding In One Chart
We've talked a lot at The Planetary Society about our strong desire to fund NASA's Planetary Science Division at $1.5 billion per year. This number doesn't come out of nowhere. It's the historical average for the program that has produced the current golden age we find ourselves living in today.
Over the summer our policy intern Lori Dajose and myself explored the recent history of planetary science funding at NASA. We went through ten years of public budgets, picked out the funding for planetary exploration, and corrected it for inflation and made it programmatically consistent. Michael Wong of Caltech helped us visualize the results you see below, which speak for themselves.
Amounts are in millions, and are plotted against the number of missions in development in the President's annual budget request.

A few things to note about this chart:
- The 2003-2012 average for Planetary Science funding, adjusted for inflation, comes out to be $1.508 billion.
- The projected data comes from the White House's FY2014 budget request, which predicts the next five years of funding for this program.
- Planetary Science funding steadily increased during President Obama's first term. The significant collapse in FY2013 was not due to Congress, but due to a new White House policy de-prioritizing planetary exploration. Congress helped soften that blow.
- We are optimistic and assume that the next small- and medium-class missions will begin in 2016 (keeping the "in development" number at 3 after the launches of OSIRIS-REx and InSight). But NASA has made no announcements that it intends to do so.
- The y-axis starts at 1.0 billion. This was for clarity in relating the drop in funding to the drop in number of missions. We are also preparing a similar plot with a full y-axis so people can compare the two separate datasets.
- Also not included on this graph: active missions, scientific research, future technology development.
- The launches in 2016 are the last launches of planetary exploration spacecraft until the Mars 2020 rover in 2020. That's a four-year gap of no new missions whatsoever.
- We've posted the raw data behind this chart as a Google Doc.
If you don't like the trend displayed above, do something about it. Write the President and your elected officials and tell them to fund planetary science at NASA.
Support our core enterprises
Your support powers our mission to explore worlds, find life, and defend Earth. You make all the difference when you make a gift. Give today!
Donate

 Explore Worlds
 Find Life
 Defend Earth

