Heather Hunter • Nov 14, 2016
GOES-R: A GOES Primer
GOES-R is scheduled launch from Cape Canaveral Air Force Station, Florida atop an Atlas V rocket on November 19, 2016. The current GOES-East and GOES-West have been faithfully providing continuous imagery and data on atmospheric conditions, Earth weather, and space weather, and even aiding in search and rescue missions for almost a decade. So, with the launch of the first of the next generation of GOES satellites, GOES-R, what is NOAA trying to accomplish?
The GOES fleet
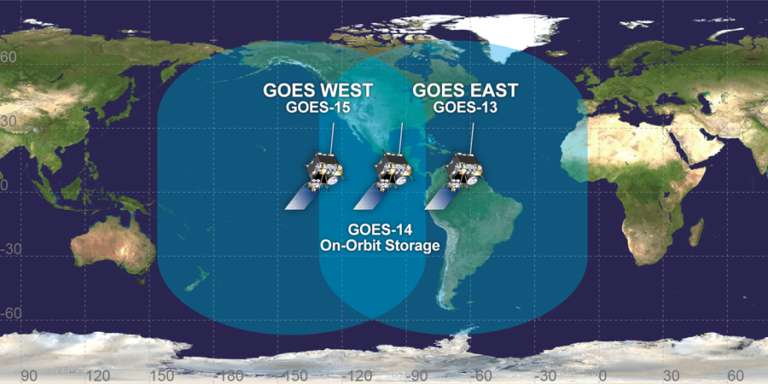
Since 1975, the National Oceanographic and Atmospheric Administration (NOAA) has operated the Geostationary Operational Environmental Satellites (GOES). At any given time, there are two of them in operation: GOES-East, which covers the Eastern Hemisphere at 75° W longitude, and GOES-West, which covers the Western Hemisphere at 135°W longitude. In case of trouble, a third satellite is usually in orbit, too, standing by until some anomaly occurs.

These satellites sit in geostationary orbit, which is 35,786 kilometers above Earth's equator. At this altitude, their orbital period is equal to Earth’s rotational period, so the satellite appears to hover in a fixed position over Earth’s surface.
When GOES-R arrives in orbit, it will sit at a fixed location of 89.5°W while it undergoes further in-orbit testing. Once operational, its environmental data products will support short-term weather forecasts, hazardous weather announcements, maritime forecasts, seasonal forecasts, drought forecasts, hurricane and storm intensity and tracking forecasts, and space weather predictions. In total it will provide 34 atmospheric, land, ocean, solar, and space weather data products for the scientific community!
Better, faster, stronger
The current GOES-East and GOES-West satellites were launched in 2006 and 2010, respectively. While they carry useful instruments and provide world-class data, the technology upon which they were built is now at least 2 decades old. GOES-R represents the first major technological advancement since then.
Most GOES satellites carry a large suite of instruments. The most important ones are the sounder, the imager, and the solar x-ray imager. GOES-R will introduce a massive new 16-channel imager called the Advanced Baseline Imager (ABI), a Geostationary Lightning Mapper (GLM), and a Solar UV Imager (SUVI) as a step up from previous GOES instruments.
ABI is unique because it will scan 5 times faster with 4 times the spatial resolution of the current GOES. This means ABI can scan an entire hemisphere every 5 minutes, or as fast as every 30 seconds in subregions where there is severe weather. Previous iterations of GOES could only provide hemispherical data every 30 minutes, and hazardous weather data every 5 minutes. In addition, ABI has 3 times the number of spectral channels from which weather data can be derived. For reference, here’s a list of all of ABI’s spectral channels, the part of the electromagnetic spectrum each covers, and what those data can be used to study.
Band | Center Wavelength (μm) | Portion of Spectrum | Observed Environmental Parameters |
1 | 0.47 | Visible | Aerosols |
2 | 0.64 | Visible | Fog, solar insolation, cloud behavior, snow/ice cover, severe weather detection, low-level cloud-drift winds, smoke, volcanic ash, hurricanes, winter storm |
3 | 0.86 | Near Infrared | Clouds, fog, aerosols, normalized difference vegetation index (NDVI) |
4 | 1.37 | Near Infrared | Thin cirrus clouds |
5 | 1.6 | Near Infrared | Cloud, snow, ice, total cloud cover estimation, smoke detection from fires with low burn rates |
6 | 2.2 | Near Infrared | Particle-size estimation of clouds and aerosols |
7 | 3.9 | Infrared | Fog/low cloud identification, fire/hot-spot identification, volcanic eruption, ash detection, snow/ice detection, urban heat islands |
8 | 6.2 | Infrared | Water vapor, jet stream, hurricane track forecasting, storm forecasting, severe weather analysis, atmospheric motion vectors |
9 | 6.9 | Infrared | Water vapor, jet stream, hurricane track forecasting, storm forecasting, severe weather analysis, atmospheric motion vectors |
10 | 7.3 | Infrared | Water vapor, mid-level atmospheric flow, jet streaks |
11 | 8.4 | Infrared | Cloud-top phase (in combination with Bands 14 and 15) |
12 | 9.6 | Infrared | Tropopause behavior, total ozone |
13 | 10.3 | Infrared | Less sensitive to water vapor - used for atmospheric moisture corrections, cloud particle size estimation, and surface property characterization in derived products |
14 | 11.2 | Infrared | Weather forecasting, analysis, precipitation estimates, cloud-drift winds, hurricane intensity, cloud-top heights, volcanic ash, fog |
15 | 12.3 | Infrared | Low-level moisture, volcanic ash, airborne dust/sand, sea surface temperature, cloud particle size |
16 | 13.3 | Infrared | Tropospheric air temperature estimation, cloud products |
GLM will detect both cloud-to-ground and cloud-to-cloud lightning from geostationary orbit. Research has uncovered a relationship between lightning activity and intensification of storms. Data from GLM will help to identify changes in lightning activity in tropical cyclones, and forecasters may then be able to determine whether a storm will have bad wind, hail, or rain.
SUVI will keep a watchful eye on the environment around Earth in the extreme ultraviolet portion of the electromagnetic spectrum. Despite being in space, space weather directly impacts life on Earth. The sun periodically releases strong bursts of charged particles that interact with Earth’s magnetic field and can disrupt satellite operations, GPS, and telecommunications. SUVI’s job is to observe solar flares and coronal mass ejections, providing early warnings to forecasters of possible impacts to the Earth-space environment, and, subsequently, on the ground.
Looking for data?
Meanwhile, if you’re a scientist or citizen scientist looking for GOES-13 (East) or GOES-15 (West) data or imagery, here are the resources you’ll want to check out. Note that you may have to write your own data readers using some kind of scientific software like MATLAB, IDL, or Fortran, if you’re not looking for pre-processed imagery. NOAA’s data guides are also available at these websites:
Support our core enterprises
Your support powers our mission to explore worlds, find life, and defend Earth. You make all the difference when you make a gift. Give today!
Donate

 Explore Worlds
 Find Life
 Defend Earth


