Anne Verbiscer • Mar 14, 2007
LPSC: Tuesday: Volcanism and tectonism on Saturn's satellites
I received this report on the Tuesday afternoon special session on volcanism and tectonism on Saturn's satellites from Anne Verbiscer, an astronomer from the University of Virginia who I first met at the Division of Planetary Sciences meeting in 2005. She recently published an interesting paper in Science about how Enceladus' spewing water ice particles coat the other satellites of Saturn and make them brighter, which I've been meaning to write about. Most of the links below go to the PDF-format abstracts of the scientists' talks. Many thanks to Anne for her notes! Toward the bottom, she notes the discussion of possible geologic activity from Dione! --ESL
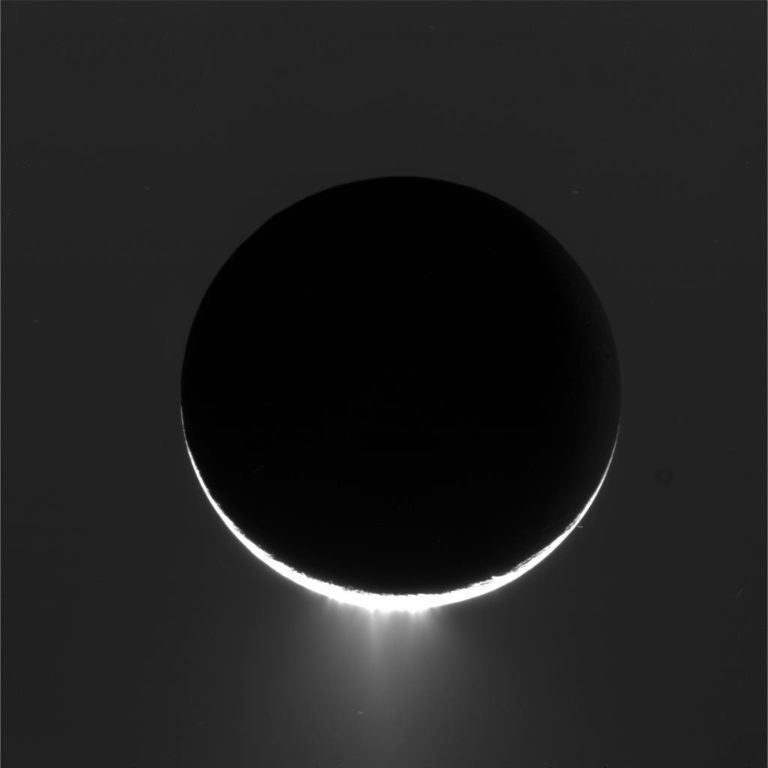
In a report on the south pole temperature anomaly [more colloquially known as the "hot spot"] on Enceladus, Oleg Abramov (and John Spencer) said that those temperatures reported on the "press release" versions of the temperatures across Enceladus (from CIRS) should be taken "with a grain of salt" because they assumed that the entire surface was radiating as a blackbody and we know now that is not the case. A new, cool (pun NOT intended?) high(er) resolution thermal map of CIRS "footprints" across the south polar terrain shows that the hottest regions are right in the centers of the tiger stripes. The "most powerful spectrum" comes from just 4.6% of the surface at a temperature of 145 Kelvin. From comparing CIRS observations made in November 2006 with those made in July 2005, they find that the total power and spatial distribution is stable on 16-month timescales. The spatial distribution is consistent with the heat coming from the tiger stripes (no surprise there). They examined three models to answer questions concerning the venting mechanism, vent temperatures, and whether or not the thermal anomaly is transient or steady state. Results show that an insulating thermal layer model does not fit the data, nor does a transient one. Only the steady-state model fits. The best fit models require vent temperatures as high as 225 Kelvin, which might strengthen the hypothesis that the vents come from a subsurface reservoir of liquid water. Also, the thermal surface properties of the south polar terrain match those of low-porosity, coarse-grained water ice. A question was asked about why the ice is coarse-grained and the answer given was that possibly the water vapor (leaving the vents) anneals to the surface.

On November 9, 2006, Cassini's Composite Infrared Spectrometer (CIRS) captured its first view of Enceladus' south polar "hot" spot since its discovery 16 months earlier. The distribution of heat suggests that most of the heat comes from the "tiger stripes," more formally known as "sulci," that cross Enceladus' south pole, although the resolution of the CIRS observation is not high enough to resolve the tiger stripes.
The images show the intensity of heat radiation in the 10- to 16-micron wavelength range, translated into temperature and displayed in false color. Peak south polar temperature on both dates reached about 85 Kelvin (minus 306 degrees Fahrenheit), averaged over the 30-kilometer (19-mile) spatial resolution of the data. However, the variation in brightness with wavelength, which is also measured by the composite infrared spectrometer, reveals that the warm region includes small areas, possibly zones a few 100 meters (320 feet) wide along the length of the tiger stripes, that are at higher temperatures, reaching at least 130 Kelvin (minus 225 degrees Fahrenheit) and perhaps much warmer still. While the south polar tiger stripes are almost certainly heated by energy from the moon's interior, daytime regions at low latitudes are warmed by sunlight to temperatures in the high 70s Kelvin (about minus 320 degrees Fahrenheit).
The blotchy appearance of the cooler regions away from the south pole, and of the sky beyond the globe of Enceladus, is an artifact resulting from the fact that apart from the polar hot spot, the composite infrared spectrometer can barely detect the very faint heat radiation from this very cold moon.
Image: NASA / JPL-Caltech / GSFC / SwRIMy notes on the next paper by Glein et al. are more sketchy... They report on hydrothermal geochemistry as a source of plume gases on Enceladus. Using the chemical composition from Cassini's INMS instrument, they have constructed thermodynamic models which try to match observations. The presence of oxidized, reduced carbon is intriguing. INMS has found no carbon monoxide and no ammonia, so the models must match this. They investigate various petrologic combinations -- fayalite, magnetite, and quartz (doesn't work); magnetite and hematite (unrealistic); pyrrhotite-pyrite-magnetite (works) -- and model an early Enceladus as having a global ocean under a thin ice shell on top of hot rock. The oxidation of primary minerals (e.g. iron) was driven by the escape of molecular hydrogen (H2). The ocean may have been quenched hydrothermal fluid. Organic matter decomposition might have been a source of organic compounds. Sarah Newman reported a potential discovery of hydrogen peroxide on Enceladus by Cassini from a weak absorption at 3.5 microns where hydrogen peroxide has a combination band. (it also has bands at 6.9 and 7.2 microns, but these are out of VIMS' reach). Hydrogen peroxide has previously been detected on Europa at a concentration of 0.13% and trace signals were also detected on Ganymede and Callisto (but only in the UV). (Unfortunately, when asked, Sarah could not provide an upper limit for the concentration of hydrogen peroxide on Enceladus.) They have found that the position of this H2O2 band shifts depending on location on Enceladus: on the tiger stripes, between them, and globally. The band is stronger and shifted to higher wavelengths in the south polar terrain. The reason can be due to higher concentration there, more amorphous ice, or a temperature effect. Because hydrogen peroxide is a product of the irradiation of water ice particles, a questioner pointed out that their model has problems if particles don't spend enough time in the plume (presumably to be exposed to the radiation that is going to produce the hydrogen peroxide?). Francis Nimmo reported on tidally driven shear heating as the source of heat for the south polar terrain. The required shear velocity is high. Their model requires a rigid shell thickness of five kilometers. Their model predicts three areas in the tiger stripes which should be at the highest temperatures (if their models are correct). Cassini can test this and to some extent has already with those November 2006 high-resolution CIRS observations.
Terry Hurford's paper really got good with the predictions of plume activity from tidal models. The idea is that since Enceladus is in resonance with Dione, its eccentricity is maintained at 0.0047. [This is a measure of how out-of-circular its orbit is. Although very close to circular, the non-circularity in combination with its synchronous rotation means that Saturn raises tides on Enceladus that bend and flex its interior, generating heat. --ESL] The height of the tide changes 1% daily and it oscillates in longitude 0.5% daily. (Europa's numbers are larger, of course.) So, based on where Enceladus is in its orbit, he models the stress along the faults in the south polar terrain. First he put the camera observations of the plumes in the context of Enceladus' orbit. In the November 27, 2005 view, Enceladus was near apocenter and all the tiger stripes were in tension. On January 16 they were at the 3/4 orbit position and on February 17 they were at 1/8 orbit before pericenter. He showed many maps of the south polar terrain with areas along the tiger stripes color-coded to correspond with whether or not they were in compression or tension. The highest plume activity seems to be correlated with when the "rift" first opens (beginning of tension). He mapped out how the stress changes through the orbit. The faults open through pericenter passage. There is an image sequence coming up next month (April) in which his predictions will be tested. The tiger stripe known as Damascus will be opening and in view of the cameras. He predicts an extremely active eruption sequence. (We'll see!) The greatest activity is near the apocenter, lowest at pericenter. There was a question about why no plume activity was seen on Europa (since the same stress calculations have been done for it...) A Galileo observation sequence was planned for this, but at the time, all of the faults were in compression. Also, gravity is much higher on Europa, so any plumes won't go nearly as high on Europa as they do on little Enceladus.

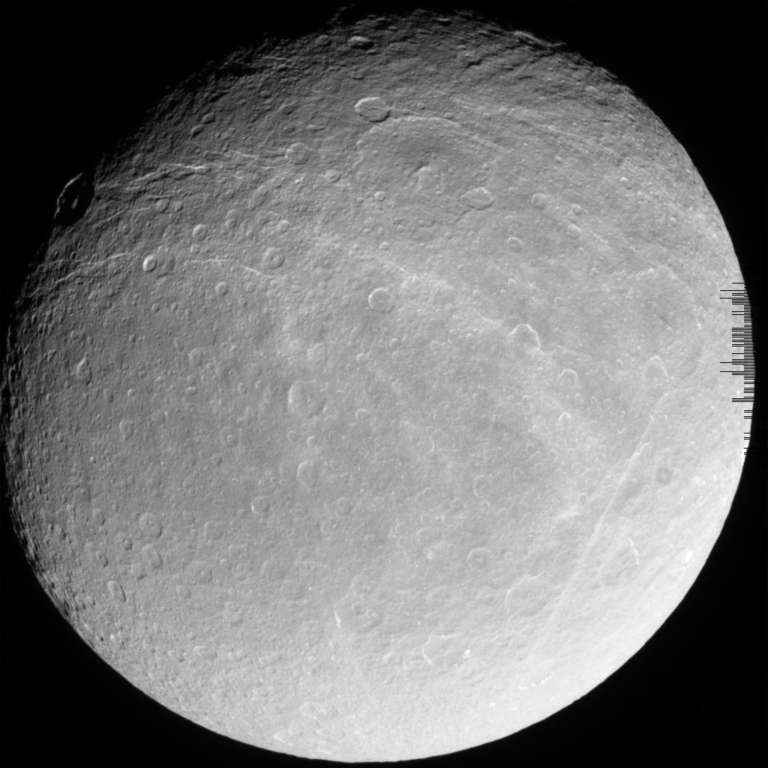
Jeff Moore spoke on the topography of endogenic features on the non-Enceladan satellites of Saturn. He's produced digital elevation models (DEMs) from Cassini by combining stereogrammetry with photoclinometry. He found tectonic features on Rhea along longitude 270° west, which form a great circle. Rhea may have bright frost deposits coming out of fractures (this is from an old Dave Stevenson paper). Rhea has graben sets, ancient ridges (Moore had a paper in 1985 on the "mega scarps" on Rhea). Dione is globally smoother than Rhea, with resurfaced plains bound on the west by a ridge, then rises to the east. An old impact feature called Amata has reappeared from the DEMs. (In early Cassini images it was thought to have disappeared; it was a feature originally written up as an ancient impact basin in the Smith et al. Sciencepaper after the Voyager flybys in the early 1980s). Tethys has concentric circles antipodal to Odysseus, possibly a result of seismic focusing from the impact (that produced Odysseus). The smooth plains on Tethys really are smooth, which shows evidence of volcanic resurfacing.

Then things really got interesting with the report of the detection of activity on Dione: Jared Leisner et al. report on Enceladus and Dione as sources of Saturn's neutral cloud from the magnetometer on Cassini. They found that Enceladus is (of course) the dominant source of water group ions, but that Dione is also a source, producing 6.5 grams per second, which is an order of magnitude above what would be produced from sputtering (0.4 grams per second). There is no evidence that Tethys is a mass source, in fact, if anything, it looks like it's a mass sink.
My battery ran out here, so, switching to handwritten notes: Bob Nelson reported the detection of cryovolcanic activity on Titan! From Cassini VIMS observations, they examined a bright spot on the surface (after checking carefully that they were not just observing a cloud that changed in size/brightness, etc.) which has changed between July 2004 and March 2006. It has increased in brightness and has changed spectrally (changed its brightness at specific wavelengths). By comparing models of various materials, methane ice, water ice, etc. the only close (not perfect) match came from modeling ammonia frost on top of water ice. (I asked him after the talk if they've looked at ammonia hydrates and they plan to do so but have not yet.) Paul Schenk asked if it could be ground fog.
Support our core enterprises
Your support powers our mission to explore worlds, find life, and defend Earth. You make all the difference when you make a gift. Give today!
Donate

 Explore Worlds
 Find Life
 Defend Earth


