Constantine Tsang • Apr 01, 2014
LPSC 2014: The Curious Case of Active Volcanism on Venus
She’s alive! She’s alive! Or is she? A little more than a week ago, at the Lunar and Planetary Science Conference 2014, evidence was presented that Venus was geologically active, not in the recent past, like 100,000 years ago, but right now. Today. As I type. A talk entitled “Bright Transient Spots in Ganiki Chasma, Venus” by Shalygin et al. showed what appeared to be active hotspot volcanism on the surface of Venus, at least that was the conclusion.
If this discovery of active volcanism on Venus stands the test of time, it could have big implications for the current heat loss on Venus and its past evolution as an Earth-like planet. Emily Lakdawalla had a great post back in 2010 on why this would be a paradigm shift. So instead, I’ll focus on this particular detection, why it’s so tantalizing yet frustrating, and place it in context of other evidence for active volcanism from Venus Express.
This detection of bright transient features on the surface was made by the Venus Monitoring Camera (VMC) onboard ESA’s Venus Express spacecraft. It is the main camera on the spacecraft, capable of observing with a relatively wide field-of-view at four distinct wavelengths. This measurement used the 1 micron filter, which detects the surface in thermal emission. Because we know what the surface looks like from Magellan as a function of altitude, and we know the lapse rate of the atmosphere, which directly affects the temperature of the surface, we can see if any location on the surface shows signs of emitting too much heat, like an erupting volcano or a lava flow. Venus Express has been looking for this telltale sign of activity ever since it entered orbit in April 2006.
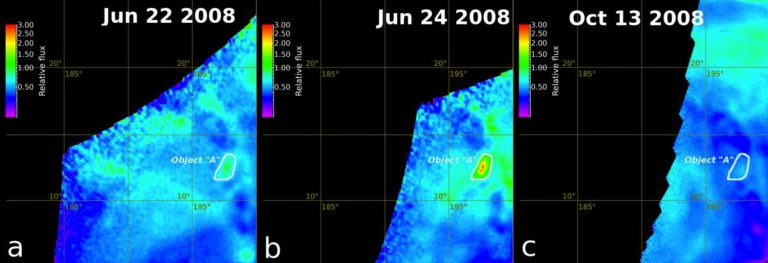
This detection was made on three dates in 2008: June 22 and 24, and then October 13 over the Ganiki Chasma region. Ganiki Chasma is a branch of rift zones near Atla Regio, a geologically young region on Venus. In June 24, a spot within this region measuring around 200 km in diameter at 198oE and 12oN (labeled "object A" in the image below) was seen to glow at abnormally high temperatures. Unfortunately, the same region was not observed again until 108 days later, by which time the thermal anomaly had subsided away, so we only have these three images to play with.

First, it’s always incredible to me that a 1-micron photon, emitted at the surface, is able to make its way to space without being completely absorbed or scattered into incoherent oblivion, a remarkable feat given the dense carbon dioxide atmosphere and the global cloud cover. Not all of the thermal emission that we see at 1 micron comes from the surface; 4% is from the atmosphere. And therein lies one of the frustrating issues with this detection. VMC does not have the capability to remove contributions from the overlying clouds: we’re never quite sure what exactly we’re seeing. Is it real changes on the surface, or just the overlying clouds messing with us?
Another instrument on Venus Express is the Visible and Infrared Thermal Imaging Spectrometer (VIRTIS). VIRTIS is for Venus Express what VIMS is for Cassini or NIMS was on Galileo. It's an imaging spectrometer: it takes images, and each pixel in each image contains a spectrum. For VIRTIS, that spectrum covers from 0.3 to 5.1 microns.
Across the near-infrared range, there are “window” regions where thermal emissions are not blocked by the atmosphere so are able to “leak out” into space. One of those is this 1 micron window. But there are others. These other windows are a combination of surface thermal emission, cloud emissions or a bit of both. We can actually remove the effects of the overlying clouds by looking at these other thermal emissions that are only modulated by cloud features to estimate the contribution to the 1 micron window that is due to clouds alone. This does a pretty good job of removing clouds from the images. This was the method used by a previous set of works (also outlined in Emily’s 2010 blog linked above) to deduce that Imdr, Themis, and Dione Regiones had high near-infrared emissivities, implying little weathering, a relatively young age for that region, and therefore geologically recent activity. And that’s certainly one way of showing recent activity, geologically speaking.
This detection by VMC is more direct in terms of trying to find active, present-day volcanism on Venus. It’s much more akin to looking at hotspots on Io. But as I’ve already said, VMC does not have the channels to remove clouds, so it begs the question, could it be clouds we’re seeing? Maybe. But from the June 22 observation, two days before the large thermal anomaly, you see the region about 2 degrees northwest and southeast of “Region A” has a similar structure to the June 24 observations, implying that “Region A” is indicative of surface features, as clouds would change the shape and intensity of features to such an extent that they don’t look the same. So perhaps it is a bright, glowing hotspot.
And another thing to consider is the effect of atmospheric Raleigh scattering. Venus' thick carbon dioxide atmosphere is very effective at scattering light. Although a 1-micron photon does not get completely absorbed, it does get scattered a lot. Studies show that from orbit, and in fact at most altitudes, the spreading effect due to Raleigh scattering is around 50 to 100 kilometers. So imaging Venus at 1 micron will always give you a blurred image near these resolutions, no matter how fancy your camera is. The fact that this bright 200-kilometer wide feature is bigger than the blurring effect means it’s at least plausible this is a real detection.
So it’s the surface we’re seeing change intensity. Huzzah, volcanism! Well...maybe not. One of the problems is really not the bright feature itself, but everything around it. Notice throughout the three images in general, there’s a lot of variations in shapes and intensities. Remember that I said the 1-micron thermal emission should reflect surface topography and altitude. If this is so, images from one frame to the next, in this case separated by at least two days, should not look different from each other. But they do in these VMC images. Apart from around “Region A”, the changes are quite marked from day to day, which leads me to think these fluctuations are a noise issue. On VIRTIS, they are able to do repeat pass summing of the same locations, increasing the signal-to-noise ratio. Here, we don’t have that luxury. By eyeball, the bright transient feature has a signal-to-noise ratio of about 5. Not the best when you only have one image with which to make this huge supposition. They don’t have any images immediately after the June 24 detection to see how the brightness decays with time, only one 108 days later.
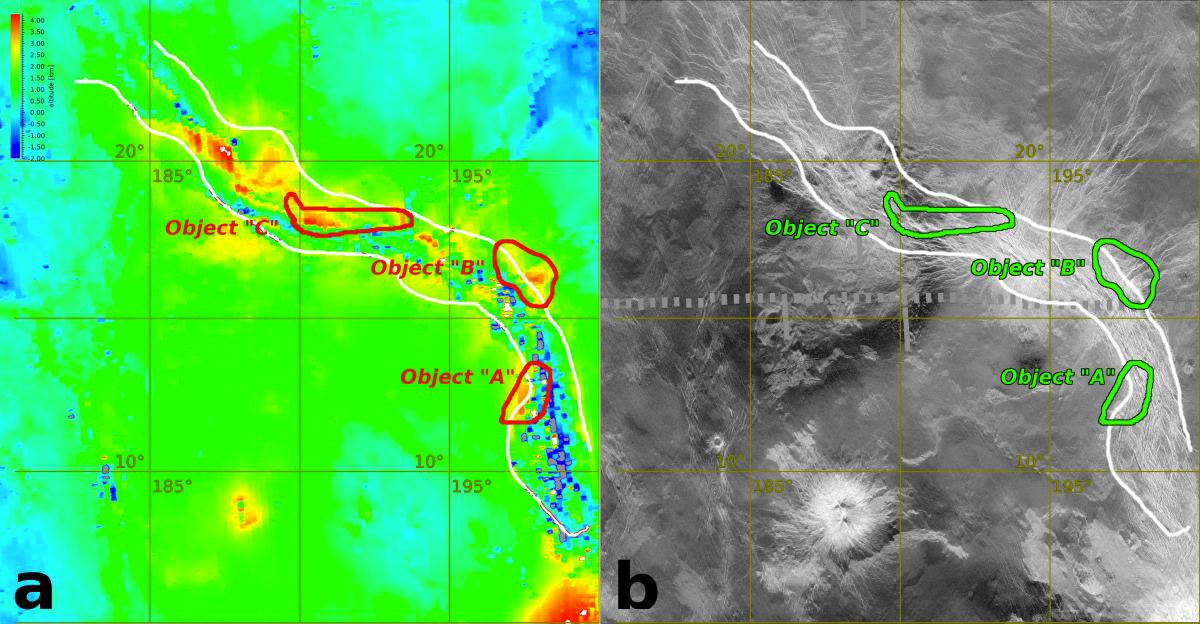
To add insult to injury, this figure from the talk shows the location on the surface that correlates to the thermal images. Again, the thermal map should look like the altitude map from Magellan. High and red locations in altitude should correspond to blue and cold components in the thermal map. And it’s not convincing that they do. So a combination of the instrument noise and the effects of the clouds significantly complicates the interpretation of these images.

How about the other instruments, like VIRTIS? Surely we can go and see if this region was active on or around these dates? Nope. Frustratingly, this region is in the northern hemisphere of Venus. The highly elliptical orbit of Venus Express was set up so that we could linger in the southern hemisphere for as long as possible during a given orbit, a consequence of wanting to stare at the polar vortices and the cloud motions for an extended period of time. Because of this, the spacecraft moves very quickly over the northern hemisphere as it rushes up towards pericenter, smearing VIRTIS images and making them almost useless. SPICAV, an ultraviolet and near-infrared spectrometer, might have the capability to observe during these phases of the orbit, but its near-infrared channels don’t reach down to the 1 micron band.
And, we can’t do many more follow-on VMC observations either. Venus Express has almost no fuel left. It needs fuel to stay in Venus orbit: being much closer to the Sun and its strong gravitational pull, Venus Express actively manages its orbit more than its sister spacecraft Mars Express, which is why Venus Express will not outlive her kin. In mid-May 2014, Venus Express will cease regular scientific observations and begin to “walk in” the orbit to prepare for aerobraking with the Venus atmosphere, which will happen a month after the end of nominal science. Any time after July, all bets are off as to when the mission will end (a topic for a future blog).
One final thing and a slight digression. On Earth and at Io, volcanic eruptions release gases as part of its plumes; carbon dioxide, water vapor, sulfur dioxide. We can’t detect carbon dioxide on Venus, because the whole atmosphere is made up of it, but we may be able to detect the other two species. In fact VIRTIS and SPICAV can do these measurements to some degree. Last year, a study of sulfur dioxide in the Venus atmosphere from Venus Express revealed a massive rise in its concentration near the beginning of its mission, which decayed away over the next few years. A similar effect was seen by Pioneer Venus spacecraft in the 1980’s. One of the suggestions made then and again in this new study is that this could be caused by buoyant plumes of volcanic gases released by some eruption on the surface. Tantalizing! Coupled with this new potential hotspot on the surface and you might think it’s a done deal for an active Venus. Well, again, it’s never that easy. These detections of sulfur dioxide in the atmosphere are made at the cloud tops, which are highly affected by vertical mixing, bringing already sulfur-dioxide-rich air from below up to the top to be seen. In essence, we could instead be seeing stochastic variations of the atmosphere and not enhancements due to volcanism.

So we’re left with more questions than answers. For me personally, it comes down to this: We can’t perfectly remove the effects of the clouds in these VMC observations of the bright transient features, so there’s always doubt as to what we’re seeing, and the fact that the other instruments on Venus Express are incapable of observing at this location means we only have this one piece of evidence which can’t be repeated or tested like good science mandates. So I’m still to be convinced. Don’t get me wrong. I want this to be right. I want there to be active volcanism on Venus, a third place in our Solar System, outside the Earth and Io, to have active volcanism. But there are too many ifs and buts for me to ignore.
Carl Sagan said: “Extraordinary claims require extraordinary evidence”. The claim that Venus is geologically active now and releasing its heat in the form of hotspot volcanism certainly qualifies as an extraordinary claim. I leave it up to you to decide if this data qualifies as the extraordinary evidence we so desperately want it to be. After all, if active volcanism is at work on Venus, what more do we need for NASA to send the next mission to Venus to study this enigmatic planet. Can anyone say “Discovery Mission?”
Support our core enterprises
Your support powers our mission to explore worlds, find life, and defend Earth. You make all the difference when you make a gift. Give today!
Donate

 Explore Worlds
 Find Life
 Defend Earth

