Emily Lakdawalla • Mar 05, 2013
Browse Curiosity's data in the Analyst's notebook
Last week the Curiosity mission made its first data delivery to the Planetary Data System. The bad news: none of the science camera image data is there yet. The good news: there are lots and lots of other goodies to explore.

The Planetary Data System (or PDS) is NASA's public data repository, and is, in my opinion, one of the greatest things that the U.S. government produces. You can find almost every bit of data from every scientific mission in one of the PDS' several different disciplinary nodes. Not only that, but the data are very well documented. And lately there have been major efforts on the part of the PDS' different nodes to make it easier to search for and retrieve specific data using different querying tools. The tools developed by the PDS Imaging Node are different from the ones developed by the Rings Node and the Geosciences Node, and this is a good thing, because it means that you have several different ways to try to query the data sets to find what you're looking for.
Most of the time I'm getting my space image data from either the Imaging Node or the Rings Node, both of which have fairly straightforward form-based search tools. But the Curiosity data are at the Geosciences Node, where they are presented very differently, because it's a very different kind of mission from Voyager or Galileo or even Mars Reconnaissance Orbiter.
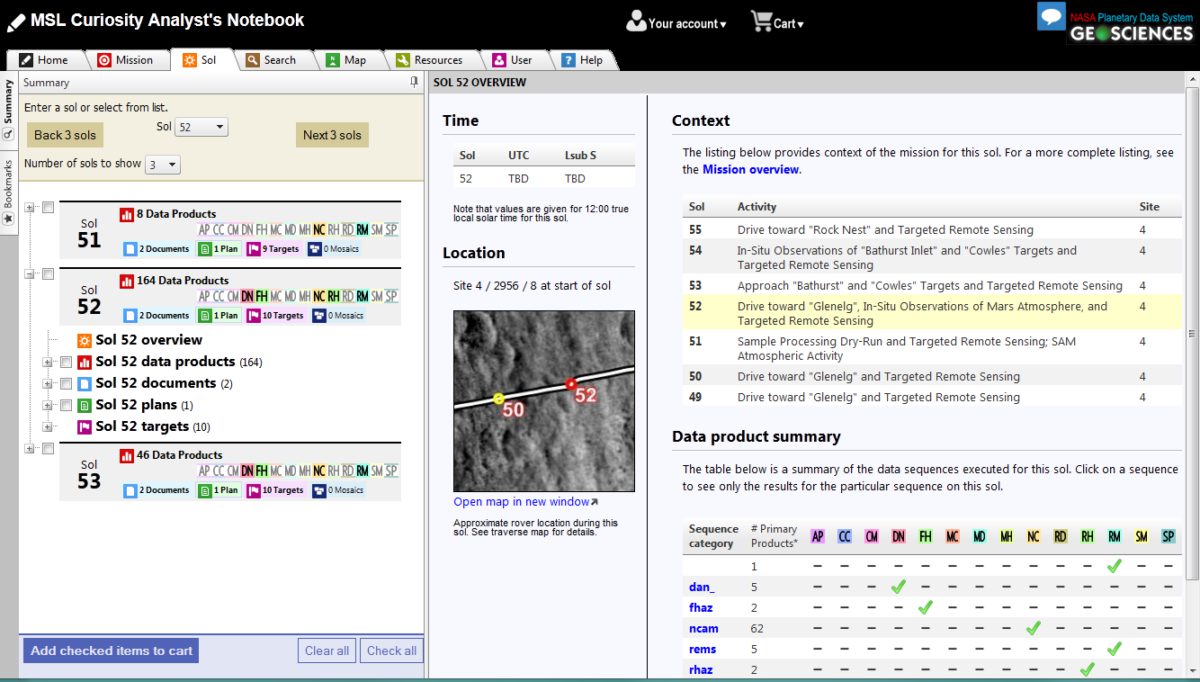
The Geosciences Node has a wonderful tool called the Analyst's Notebook, where you get a holistic view of landed missions; they present Apollo, Phoenix, LCROSS (which is kind of a landed mission, I guess!), Spirit and Opportunity, and now, Curiosity data through individual Analyst's Notebooks. In addition to the science data (images, temperature measurements, etc.) there is a tremendous quantity of information about the operational mission, in the form of timelines, maps, notes, daily reports, and much more, all of it cross-linked and interconnected.
The first Curiosity data release covers sols 0 through 89, so it covers landing through most of the work at the Rocknest site. Now, before you get too excited, the first data release was only a partial one. There's no SAM or Chemin science data yet; those are supposed to come in a month. I didn't expect to actually understand those data anyway, so I'm not bothered. I'm a little more annoyed that the MARDI, Mastcam, and MAHLI data hasn't been provided to the Planetary Data System yet. It's not as bad as it might be, though, because at least reduced-quality versions of all of those images have been released via JPL's raw image website and can be explored through a variety of fan-created sites (here's my current favorite). It's an inconvenience that the images are not available within the Analyst's Notebook, but an inconvenience that won't last forever.
Anyway, go to the Curiosity Analyst's Notebook and one of the first things you'll see is a big blue button that says "New User? Start here". Clicking on that will bring you to a list of some places to start, ordered by increasing complexity. You can explore the press-released images but you've likely seen all of those. The third item listed is a small but very useful resource: very brief (less than tweet-length) summaries of each sol's activities, in both a browseable and a downloadable form. I highly recommend exploring the interactive rover traverse map. There are lots of things that you can click on to get popups and click through to reach more information. I could provide some step-by-step instructions but this is a system that rewards exploration. Just click on things and see what happens. Look for little plus symbols that'll open up folder hierarchies.
My favorite things in this first data release are the documents, plans, and targets provided for each sol. There are two main documents. Each sol's planning starts with the mission manager's downlink report, which is a very quick-and-dirty bullet list summarizing the current state of rover health and some notes on short-, medium- and long-term planning. There's a lot more information in each sol's uplink report. This one is a treasure trove, containing explanations I've been missing for why the rover took specific images on specific days. There's a tabular list of the activity plan that the science team requested, each activity explained with a rationale. It's followed by detailed notes taken during the Science Operations Working Group (SOWG) meeting, which is where all the scientists gather to discuss what the plans should be before they hand the plan over to the engineers to turn it into rover commands.
That list of rover commands is the activity plan. You can choose to view this either as a list or a timeline. I find the timeline view much easier to understand, though it would spread across about six of my screens. Here's most of sol 52, in one gigantic chart.
Here's a zoom in on a couple of hours of activity. Sol 52 was a fairly typical driving sol, just before they got to Rocknest:
At this scale, it's impossible to read any text, but that's a good thing, because it helps you see the shape of the sol without getting bogged down in details, as long as you're not colorblind. (If you are, you'll have to enlarge the image to be able to read text to figure out what's going on.) The timeline tracks two broad groups of activities: science data acquisition (colorful bars), and all the engineering/housekeeping activity (gray bars). Not all of the bars are wide enough to contain text, but mousing over them shows you stuff like the names of Mastcam observations. You can see from here how RAD (olive) and REMS (aqua) took their environmental measurements at regular intervals all day long. Other instruments were used less frequently. Mastcam (pale peach) and DAN (pink) performed pre-drive science, and then the rover drove someplace (gray), with the usual Navcam panorama (pale orange) taken after the drive had ended. But there was another Navcam observation plunked in the middle of the timeline. Why did they do that? Well, it becomes clear when you read the uplink report (emphasis mine):
The priority in the current plan is to continue driving east towards Glenelg (the rover planners are planning for a distance of 38 m), perform three science blocks (pre-, mid- and post-drive), and complete a 7-hr SAM atmospheric observation. A continuing high priority for the theme groups is the selection of a “scoopable” target. Along these lines, GEO is requesting a mid-drive 360 navcam, as well as post-drive navcams (to complete a 360 pan) and 2 mastcam pans that cover the “Arvidson Accumulation Area” and its surroundings. The GEO team also wants to start imaging from the horizon to the rover feet to begin studying geologic contacts as we head to Glenelg. MIN chose three targets with interesting properties (a large clast, a conglomerate, and a “duricrust”) to image with mastcam.
Click on the targets and you'll see a rogue's gallery of Navcam images of the named rocks that they decided to image on that sol. As I mentioned earlier, there are no Mastcam images in the Analyst's notebook yet. But all the images are out in raw form, and it's a simple matter to run to the sol 52 page on Mike Howard's Midnight Planets website and match Mastcam images to their names from the Analyst's notebook target list. This one is called Valliant and is presumably the "large clast" referred to in the uplink report; this one is Kuuvick the conglomerate (and a really lovely conglomerate too), and this one is Hackett, the "duricrust" bit.
People with much more time and programming ability than I are digging into the non-image data and coming up with creative ways to use it. We're discussing that activity in a dedicated PDS thread over at unmannedspaceflight.com. Here is a fun video that Joe Knapp produced from some of the navigational data using a $15 3D computer model of the rover that he purchased at renderosity.com. It shows some of the first activity with the arm, including its use to shoot a set of photos underneath the belly of the rover, on sol 34.
If you're interested in understanding the rationale for rover activities, go explore the Analyst's Notebook! The rest of the first data release is coming out on March 20; the second data release covering up to sol 180 or so will be out on May 30. And if you want to hop to the other side of Mars, go see Opportunity's Analyst's Notebook. They have recently posted their 35th release of science data!
Support our core enterprises
Your support powers our mission to explore worlds, find life, and defend Earth. You make all the difference when you make a gift. Give today!
Donate

 Explore Worlds
 Find Life
 Defend Earth


