Paul Schenk • Feb 03, 2015
Ceres Coming Into View
This article originally appeared on Paul Schenk's blog and is reposted here with permission.
It's begun! Dawn is on approach to Ceres, the largest of the asteroids, and is starting to resolve features. We have now seen two sets of images, one on January 11 the other on January 26. Indistinct curved marking and subtle shadings are apparent. Some markings look like craters, others like fracture or fault scarps. The fact that these features are not obvious at this point is intriguing. Perhaps they will prove to be like features we are familiar with on icy satellites of Saturn, the objects most similar to Ceres in size and composition. Perhaps not.
The best Ceres images from January are at best ~20-22 kilometers resolution. Lots of features are hidden to us at this scale. Nonetheless here is a reprojected version one of the new images, one unmarked, the other marked by what appear to be scarps or topographic features, all of which at this point seem to suggest a chain of craters or an elongate trough. We should know by mid-February whether that is correct.

February will be revealing. We should have a fair idea by the end of this month of the basic nature of Ceres' surface and a crude outline of its geology, at least if our experiences with Voyager and Cassini at Saturn are any guide. As the images of Saturn's moons show, we can learn some basic facts from the expected Ceres images, which will be as good as ~4 kilometers per pixel by the end of the month.
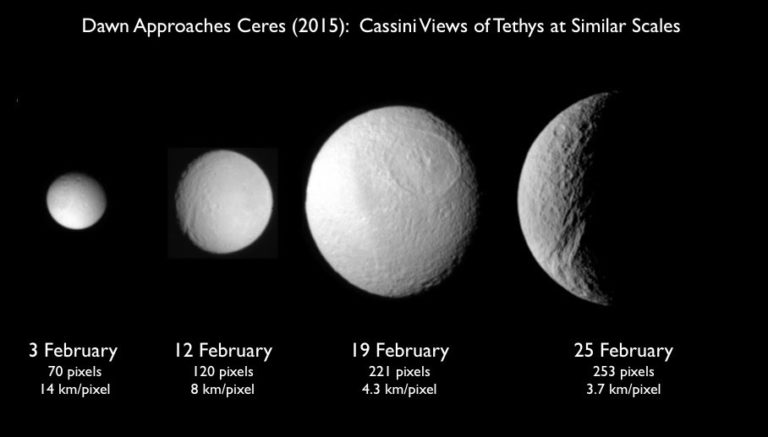
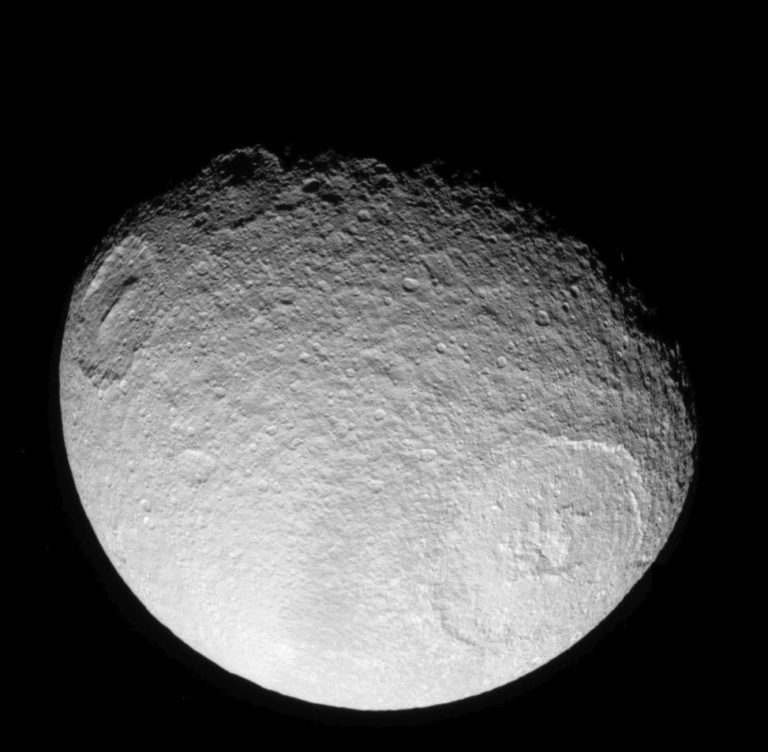
To get a sense of what the new images in February might tell us about Ceres, I've dug up some Cassini images of Saturn's icy moons. Take Tethys. Famous for its really large and deep impact basin Odysseus and nearly globe-girdling fault valley Ithaca Chasma. Odysseus is ~430 km wide and at least 8 kilometers deep. Several other deep craters make Tethys a useful comparison. Ithaca Chasma is a prominent fracture system 75 to 115 kilometers wide, several kilometers deep and nearly circles the globe. Both features are prominent and possible analogs for what we might see on Ceres.

The great tectonic trench Ithaca Chasma would be visible in the 12-Feb images, and possibly on the 3rd. The large impact basin Odysseus is the large circular feature in the 19-Feb scaled image, but it is interesting that even thigh more than 8 kilometers deep, it does not convey a sense of enormous depth in these views.Image: NASA / JPL-Caltech / SSI (composite by Paul Schenk)
What will we be doing with these February data? The most obvious thing will be an inventory of the types of features we can identify with confidence. This will give us a sense of the type of work we can do when mapping really starts in April.
After the rush to Ceres in February we enter a month-long period where our mapping will not improve. During all of March Dawn will perform an intricate celestial dance as it maneuvers toward its first high-altitude mapping orbit. This first "Survey Orbit" will allow us to map at ~1.3 km/pixel but it will take most of April to get there as we slowly spiral in. [See Chief Engineer Dr. Marc Rayman's blogs detailing Dawn's trajectory and mapping phases. ] With these mapping data in hand we can start cataloging and measuring geologic features to test our hypotheses of Ceres' geologic and thermal history and its internal composition. Is there evidence of internal heat, either now or in the past? Is Ceres partly made of water ice and is that ice found mostly in the upper mantle? Compositional mapping will also start. We should also get our first indications of the gravity field of Ceres, but the real work of gravity mapping must wait till be get to lower altitudes.

During March, however, Dawn will be a little bit further from Ceres than we are on 25-February. We will also be returning fewer images. These will include some high-phase crescent images, though, which will be better suited to searching for outgassing and vapor clouds around Ceres (if any are to be found). These are the type of images that show off the Enceladus jets so well.
All this is great fun, but the real action begins in late April when we start global mapping of Ceres at scales comparable to the other icy worlds of Jupiter, Uranus and Neptune, and begin to resolve the smaller-scale geologic features that tell us about impact, volcanic, tectonic and erosional processes going on at Ceres. It seems appropriate that we should begin our mapping of Ceres, named for the roman goddess of agriculture and fertility, in the springtime (at least in the northern hemisphere). We should then be mapping features 1 to 1.5 kilometers across, similar to Voyager 2 mapping of much of Ganymede and Triton.
Support our core enterprises
Your support powers our mission to explore worlds, find life, and defend Earth. You make all the difference when you make a gift. Give today!
Donate

 Explore Worlds
 Find Life
 Defend Earth

