Squiggly lines
![Squiggly lines](https://planetary.s3.amazonaws.com/web/assets/pictures/_1200x748_crop_center-center_82_line/110671/20181204_osirisrex-otes-atmosphere-readings-2018-11-29.jpg 1200w, https://planetary.s3.amazonaws.com/web/assets/pictures/_768x479_crop_center-center_60_line/110671/20181204_osirisrex-otes-atmosphere-readings-2018-11-29.jpg 768w, https://planetary.s3.amazonaws.com/web/assets/pictures/_576x359_crop_center-center_60_line/110671/20181204_osirisrex-otes-atmosphere-readings-2018-11-29.jpg 576w)
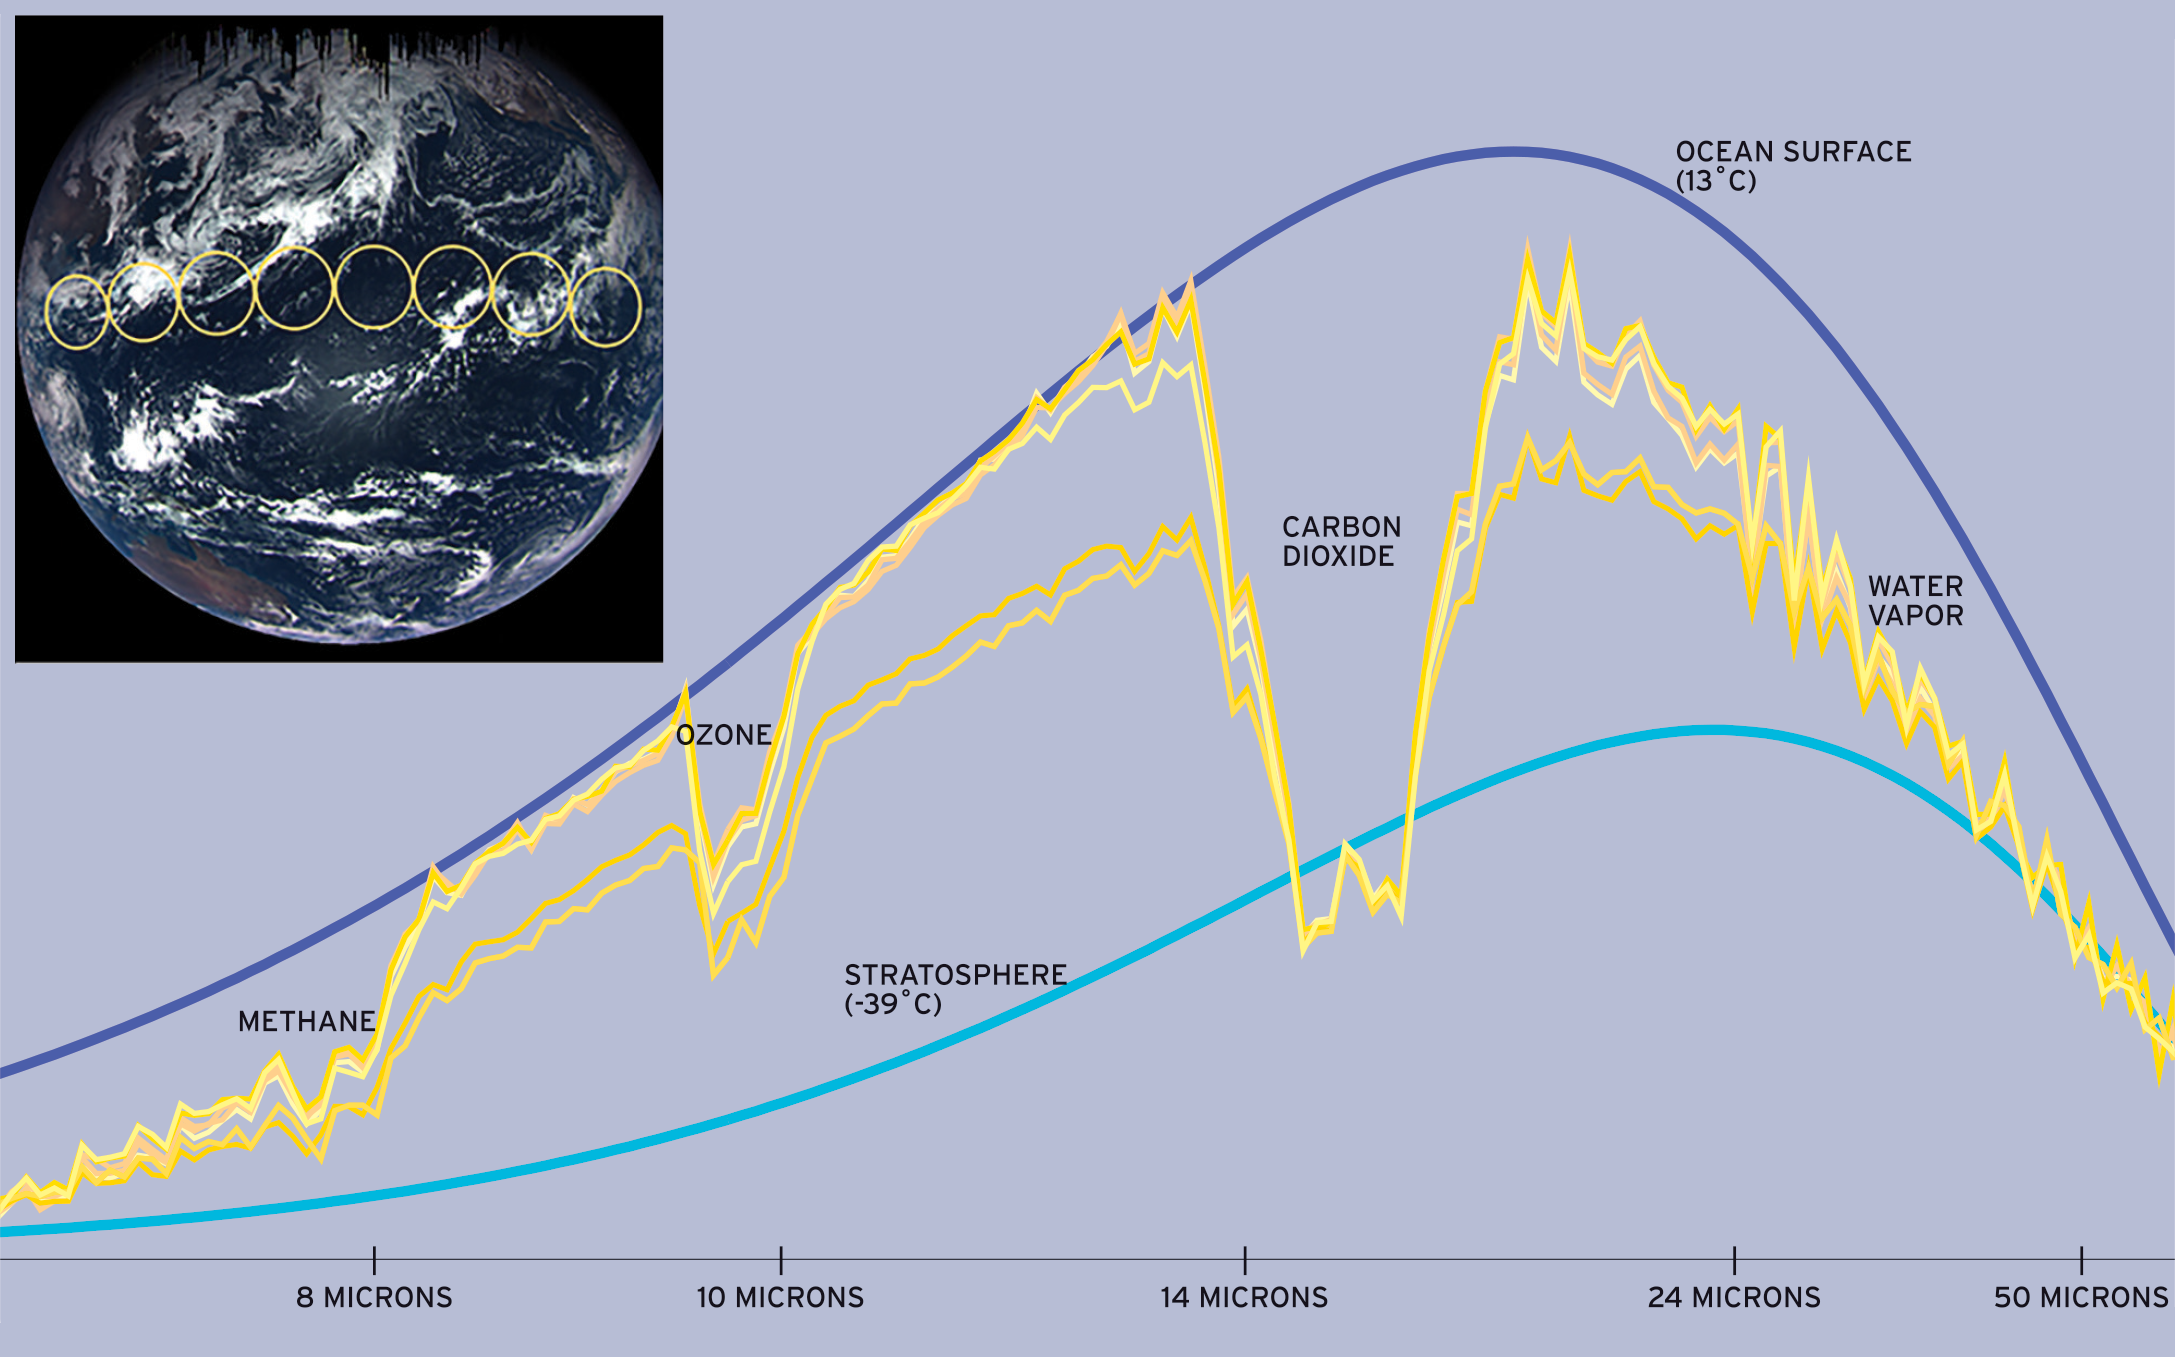
INSET: The OTES instrument gathered its spectral data at nearly the same time that MapCam took this photo. The yellow circles, each 800 kilometers (500 miles) in diameter, show the approximate locations and sizes of the spots on Earth scanned by OTES to produce these curves. NASA / GSFC / UA / ASU / The Planetary Society